


Leading Market Indicators and Tipping Points
Stock-Markets / Financial Markets 2011 Mar 25, 2011 - 02:22 AM GMTBy: John_Hampson

 As a financial markets trader I can only make money by successfully predicting the future to some degree. Therefore I am more interested in market analysis and less interested in market commentary. I am more interested in leading indicators and less interested in coincident and lagging indicators. I am more interested in tipping points and less interested in known issues. I understand that all data flow and newsflow is by necessity after-the-event, but I can focus on flow that has historically consistently correlated with future market performance.
So, I'll not dwell on coincident and lagging indicators in this article, which would include:
1. GDP
2. Personal Income
3. Retail Sales
4. Employment
5. CPI
6. Industrial Production
And I'll move straight on to leading indicators:
7. Conference Board leading indicators composite - positive and strong:
Source: Briefing.com
8. ECRI leading indicators composite - possible negative divergence in the weekly leading index but no divergence in the weekly leading index growth rate:
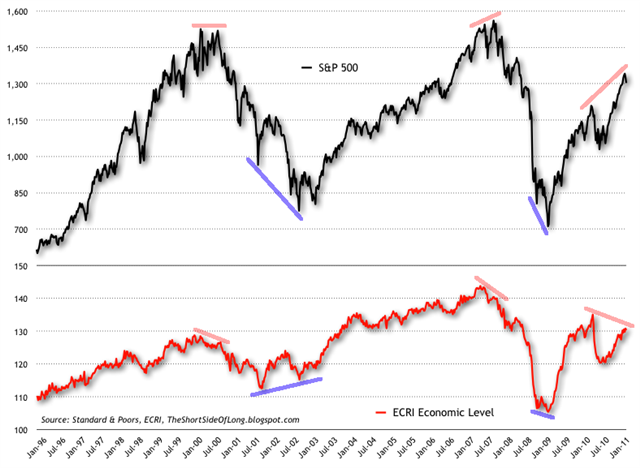
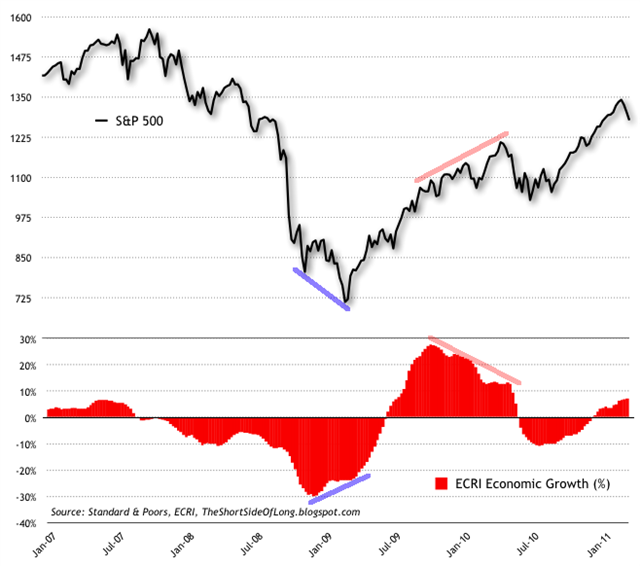
Source both : Shortsideoflong blogspot
9. OECD leading indicators - this data looks out to around July time and there are concerns only for China, India and the PIIGS. Japan, Germany, US and Russia are particularly strong:
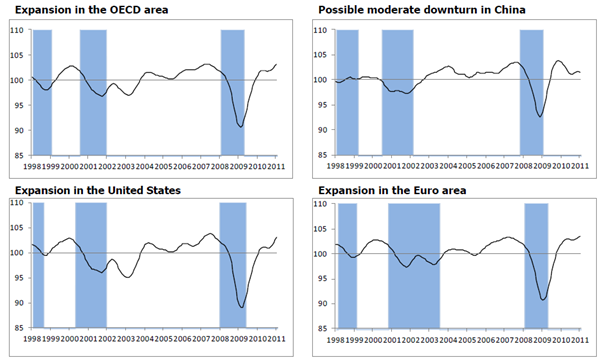
Source: OECD
10. Money Supply - growth is positive and strong, whilst the money multiplier which is weak and weakening. This means the banks aren't lending. However, if the ratio was over 1 then the strong money supply growth would likely translate into major inflation. A watch item:
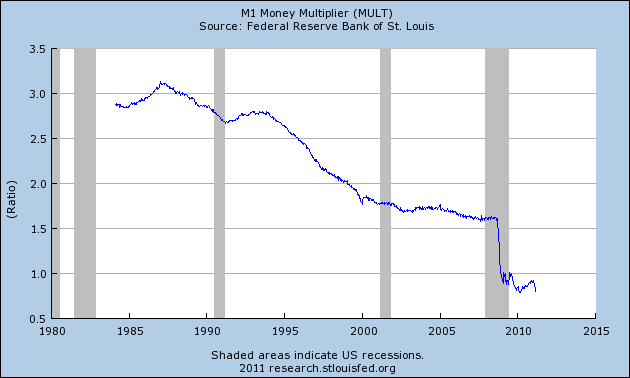
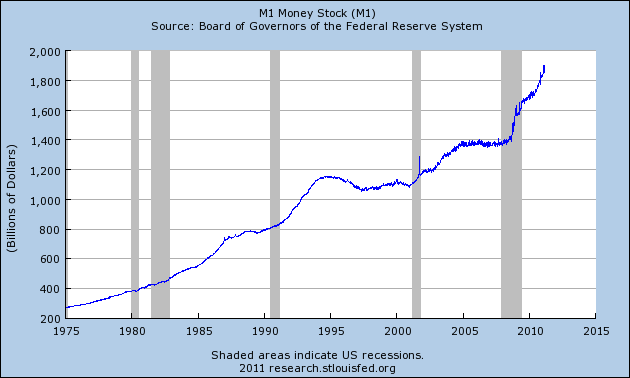
Source: St Louis Fed
11. Stock Market returns - the bull trend remains in place and is therefore forecasting positive
12. Manufacturing data - particularly strong
13. Consumer sentiment/expectations - weak of late
14. Yield curve probability of recession - very low likelihood of imminent recession
15. Ciovacco Bull Market Sustainability Index - positive from 2 months to 1 year out
16. Bloomberg Financial Conditions Index - moved back into positive territory
In summary, leading indicators are overall positive and strong, both in the US and globally, but with the following concerns or watch items: potential ECRI divergence, M1 multiplier, US consumer sentiment/expectations, China and India.
--------------------------------------------------------------------------------
Let's now turn to Known Issues and Tipping points, and, again, I'll not dwell on the former but focus on the latter:
In relation to point 17, the charts below reveal the threat to stocks that oil over $105 and rising may represent. This is also reflected in research by Bespoke, revealing the negative historical impact on stocks of a period of strongly rising oil prices.
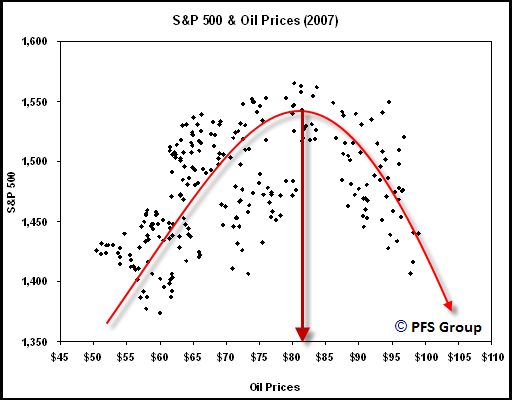
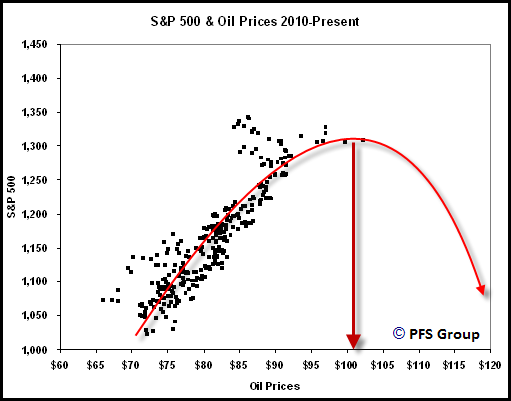
Source: PFS Group
In summary, the oil price represents the biggest current threat to stock market performance and the economy, with watch items of global inflation, the US dollar and Chinese leading indicators.
John Hampson
John Hampson, UK / Self-taught full-time trading at the global macro level / Future Studies
www.amalgamator.co.uk / Forecasting By Amalgamation.
© 2011 Copyright John Hampson - All Rights Reserved
Disclaimer: The above is a matter of opinion provided for general information purposes only and is not intended as investment advice. Information and analysis above are derived from sources and utilising methods believed to be reliable, but we cannot accept responsibility for any losses you may incur as a result of this analysis. Individuals should consult with their personal financial advisors.
© 2005-2022 http://www.MarketOracle.co.uk - The Market Oracle is a FREE Daily Financial Markets Analysis & Forecasting online publication.