


Current Outlook for Stocks, Commodities and the US Dollar
Stock-Markets / Financial Markets 2011 Mar 28, 2011 - 06:53 AM GMTBy: John_Hampson

 Since my analysis of March 17th, "Stock Market Buying Opportunity", US and European stock indices have risen 5-8%. Indices have broken through key resistance, key moving averages and made positive MACD crosses, plus small caps have outperformed, which is typically bullish. On the bearish side, volume has made a negative divergence, as shown below, and we do not see a typical positive Nymo divergence which would usually require another corrective leg down.
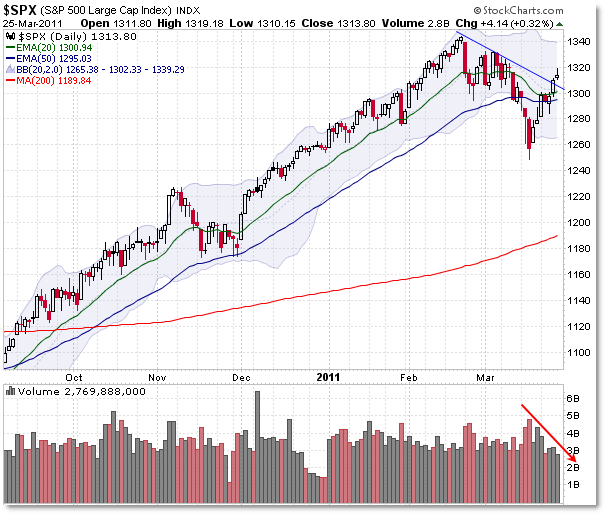
Source: AfraidToTrade
Leading indicators continue to be largely positive and strong (as covered in my analysis of March 24th) and cyclical bull topping indicators continue to be absent (as covered in my analysis of March 17th). Cyclical bull time forecasting predicts a stocks bull to continue into 2012.
The key headwinds now are the oil price and historical stocks returns in this period.
I cover crude oil below, but in short I expect a battle between stocks and crude if oil continues to rise above $105 (see my March 24th analysis), as historically strong crude rises have dragged down stocks. It is unlikely that both can continue to rise simultaneously, at current crude price levels and above.
Regarding historical stock returns, this quartile of the cyclical stocks bull coupled with its internal strength to date gave us a rough target range of 1280 to 1350 S&P by June (March 17th analysis). Considering cyclical bulls within secular bears have lasted on average 129 weeks and made 104% gains and we have currently made 98% gains on the S&P from the March 2009 low, some digestion of gains would be appropriate if the bull is to continue into next year.
QE/Pomo remains supportive until April 27th, at which meeting the Fed will signal to what extent this programme is to continue. If the Fed signals no QE3 then the markets could stage a pullback as of late April, despite QE2 continuing through to June. On the other hand, some form of programme continuation would be bullish. It remains an unknown. April is a seasonally strong month for stocks and US earnings season begins on April 11th.
Given all the above, I have taken partial profits on stock indices longs in place since March 17, and retain the remainder. I have no stock indices shorts.
--------------------------------------------------------------------------------
Gold and Silver
I have previously reasoned (March 7th, February 1st) for a parabolic secular conclusion for precious metals, with a rough price target of $2000 for gold and a time target of 2011-2013. My strategy is simply to continue to hold gold and silver until enough time measures and indicators line up to suggest we are seeing that conclusion.
I am slightly overweight gold compared to silver because gold hit a long term buy signal in February whereas silver did not, silver doubled in a steep move the last 6 months whereas gold has been building out an inverse head and shoulders or cup and handle formation which typically precedes a big move up. Nevertheless, the gold:silver ratio is close to the historic average, suggesting silver was just playing catch up following underperformance around the recession and that its recent doubling was not excessive.
--------------------------------------------------------------------------------
Agricultural Commodities
In my analysis of March 16th, I reasoned for continuing to hold a basket of softs whilst global inventories remain low and trends in natural phemonena, monetary condition and the oil price remain supportive, but for not adding to the position due to Spring climate forecasts and seasonality. Agricultural commodities have generally risen around 5% since then.
That remains my stance, with the latest forecasts suggest La Nina will be gone by June, giving rise to more normal conditions, although it is producing some floods and droughts before it wanes.
Looking further out, early forecasts suggest a more-active-than-usual US hurricane season from June to November this year. Agricultural commodities in the firing line for land-hitting storms are orange juice, cotton, grains and sugar.
For now, I continue to hold a broad basket of agricultural commodities and will not be adding. I have no short positions.
--------------------------------------------------------------------------------
Natural Gas
In my analysis of February 28th, I reasoned for being long Natural Gas for the month of March, based on inventories, seasonality, weather forecasts, and extreme historic cheapness to rising oil prices. Natural Gas rose 10% in the month.
Whilst some abnormally cold weather did materialise, demand was not sufficiently high to draw down on inventories and gas stock levels have moved back into the middle of the historic range.
Source: EIA
On the other hand, the Japanese disaster has made Natural Gas relatively more attractive to nuclear fuel, and early forecasts suggest a more-active-than-usual US hurricane season from June to November this year. With the Gulf coast accounting for more than 40% of natural gas production, such a season would likely translate into rising prices, if only fear spikes.
With March positive seasonality done, and inventories back in mid-range, I have taken partial profits on Natural Gas and retain the remainder longer term, based on continued historical extreme cheapness to oil, the anticpated hurricane season, and political favour due to Japan's nuclear issues.
--------------------------------------------------------------------------------
Crude Oil
In my analysis of February 28th, I reasoned for staying long crude oil, due to positive seasonality from March to September, troubles in the Middle East and North Africa likely lasting all the way through to new elections, strong global growth forecasts and global demand back at all time highs. Crude oil has risen around 7% since then. There is some premium, maybe up to 10%, to the current oil price based on the real supply reduction from Libya and the geopolitical uncertainty of that wider region. Positive developments in this part of the world could make for a near term price pullback, but I maintain that the uncertainty will remain generally supportive for some time. Crude oil inventories still remain historically high, due to a buildup during the recession, but we are into the seasonally strong time where stocks are drawn down.
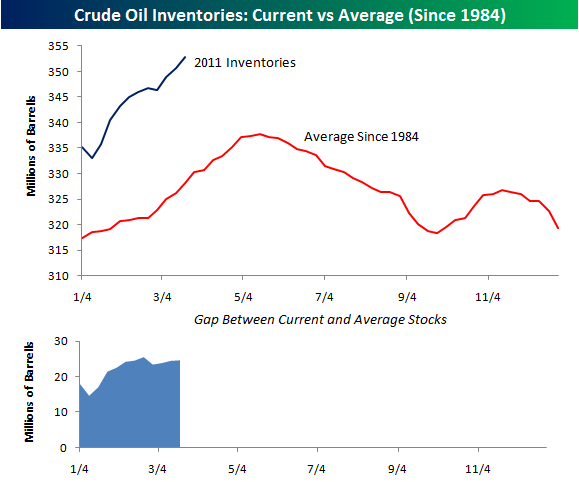
Source: Bespoke Investment
As mentioned above in the stock market analysis, crude oil prices above $105 are likely to battle with stock indices for further gains, the two being incompatible. I expect some digestion of gains for crude, but longer term see crude oil going to at least $150, as per my analysis of March 7th.
I continue to stay long crude oil, but not adding to the position near term.
--------------------------------------------------------------------------------
US Dollar
In my analysis of March 21st I contrasted a technically weak US dollar with a level of sentiment against the dollar that historically implied a bounce, and did not want to take a position either way until that was resolved. The US dollar has since bounced and the question now is whether it is backtesting the breakdown before dropping further (first chart below) or whether a more sustained bounce is to materialise along with a pullback in most other assets (second chart below).
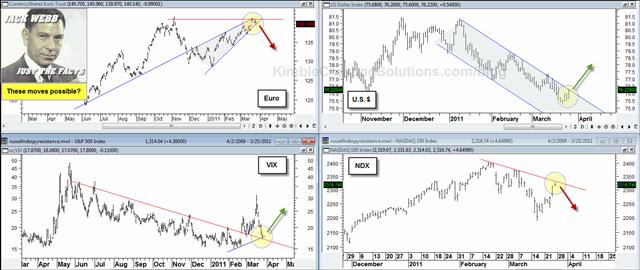
Source Both: Chris Kimble
I continue to have no positions long or short in the US dollar, whilst this becomes clear. For reasons noted above, some digestion of gains for both stocks and oil and softs would be appropriate, which would fit well with either a sustained dollar bounce or sideways range action. Longer term I still expect a US dollar breakdown to accompany a secular commodities bull conclusion.
John Hampson
John Hampson, UK / Self-taught full-time trading at the global macro level / Future Studies
www.amalgamator.co.uk / Forecasting By Amalgamation / Site launch 1st Feb 2011
© 2011 Copyright John Hampson - All Rights Reserved
Disclaimer: The above is a matter of opinion provided for general information purposes only and is not intended as investment advice. Information and analysis above are derived from sources and utilising methods believed to be reliable, but we cannot accept responsibility for any losses you may incur as a result of this analysis. Individuals should consult with their personal financial advisors.
© 2005-2022 http://www.MarketOracle.co.uk - The Market Oracle is a FREE Daily Financial Markets Analysis & Forecasting online publication.