


Japanese Yen Big Surprise
Currencies / Japanese Yen Mar 29, 2011 - 12:13 PM GMTBy: Tony_Caldaro

 As a followup to our recent long term report on the Japan Nikkei equity index we present our a long term analysis on the JPYUSD. The Yen is a western economy currency which generally follows the CHFUSD long term currency cycle model, as opposed to commodity sensitive currencies like the AUDUSD, CADUSD and ZARUSD. The CHFUSD model displays Cyclical tops and bottoms every 16-17 years, with the bottoms occurring only 6-7 years after the tops. The long term charts of the JPYUSD display this currency cycle quite well with a slight variation at the lows.
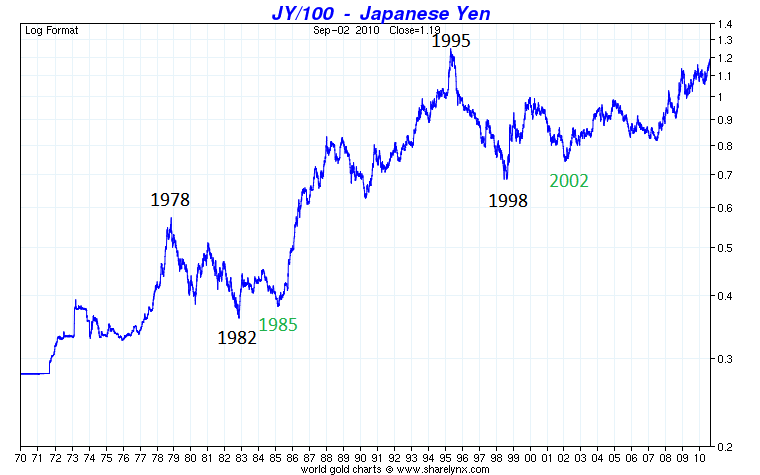
The above chart displays the currency cycle quite well over the past 40 years. Notice the Cyclical tops in 1978, 1995, and the rise into the next scheduled top in 2012. The Cyclical lows, however, occur much more quickly than the general model. Instead of the typical 6-7 year decline the JPYUSD makes a low in 3-4 years and then a secondary (higher) low at the normal end of the 6-7 year decline. This will be important after the JPYUSD tops next year. The monthly JPYUSD chart displays the same pattern from 1980-2011 with the OEW labeling.
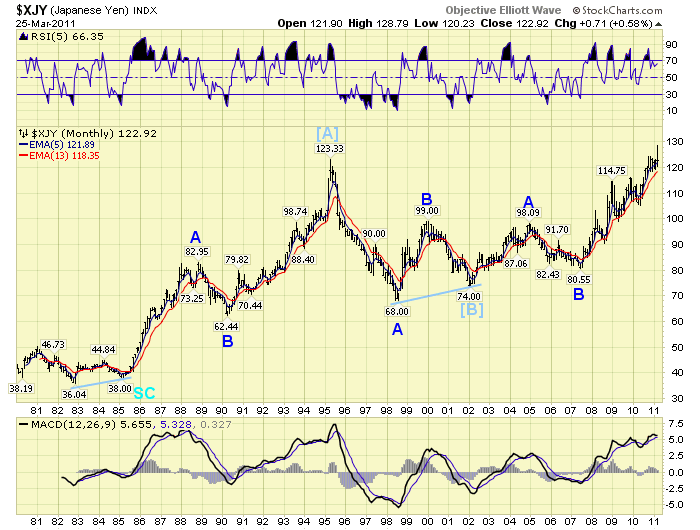
A JPYUSD Supercycle bull market began in 1985 at 38.00. Cycle wave [A] contained three Primary waves and ended in 1995 at 123.33. The Cycle wave [B] bear phase unfolded in three Primary waves as well and bottomed in 2001/2002 at 74.00. Since then the Cycle wave [C] bull phase has unfolded, completing two of the Primary waves, and will likely conclude Primary wave C in 2012.
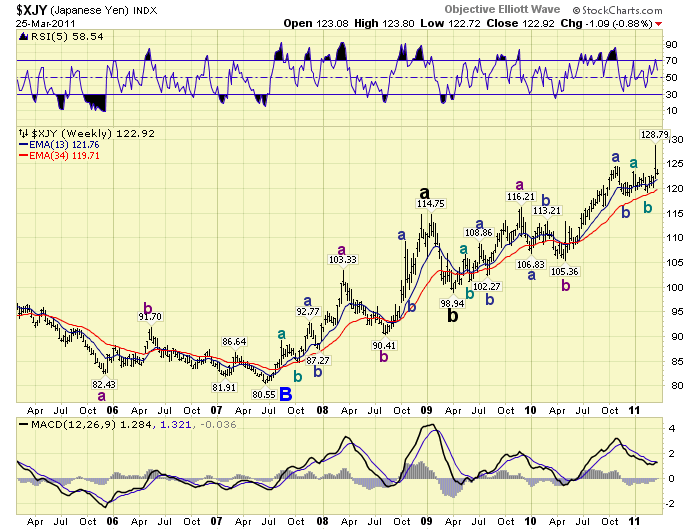
A closer view of Primary wave C is presented in the JPYUSD weekly chart. Notice Primary C has divided into the typical three Major waves: Major wave A ended in Jan09 at 114.75 and Major wave B in Apr09 at 98.94. Major wave C is dividing into the typical three Intermediate waves: Int. wave A ended in Nov09 at 116.21 and Int. wave B ended in Apr10 at 105.36. Therefore the JPYUSD is currently in Int. wave C, of Major wave C, of Primary wave C, of Cycle wave [C] of a multi-decade Supercycle bull market. Fibonacci price analysis of the final waves of this bull market suggest the following upside price target: @ 133.1 Major C = Major A, and @ 133.2 Int. C = 1.62 Int. A. The JPYUSD appears to have a lot more to go on the upside before topping in 2012. To follow this currency pair with us go to page 15 on the following
CHARTS: http://stockcharts.com/...
http://caldaroew.spaces.live.com
After about 40 years of investing in the markets one learns that the markets are constantly changing, not only in price, but in what drives the markets. In the 1960s, the Nifty Fifty were the leaders of the stock market. In the 1970s, stock selection using Technical Analysis was important, as the market stayed with a trading range for the entire decade. In the 1980s, the market finally broke out of it doldrums, as the DOW broke through 1100 in 1982, and launched the greatest bull market on record.
Sharing is an important aspect of a life. Over 100 people have joined our group, from all walks of life, covering twenty three countries across the globe. It's been the most fun I have ever had in the market. Sharing uncommon knowledge, with investors. In hope of aiding them in finding their financial independence.
Copyright © 2011 Tony Caldaro - All Rights Reserved Disclaimer: The above is a matter of opinion provided for general information purposes only and is not intended as investment advice. Information and analysis above are derived from sources and utilising methods believed to be reliable, but we cannot accept responsibility for any losses you may incur as a result of this analysis. Individuals should consult with their personal financial advisors.
© 2005-2022 http://www.MarketOracle.co.uk - The Market Oracle is a FREE Daily Financial Markets Analysis & Forecasting online publication.