


Gold Breakout and Silver Going Parabolic
/ Gold and Silver 2011 Apr 07, 2011 - 05:46 AM GMTBy: Jordan_Roy_Byrne

 We obviously have been too cautious on Silver. The metal has been on a tear and has shown no weakness in the past few weeks. Our upside targets were $37 and $39. A clean break of $39, which seems imminent will send the market to $45 and possibly $50. Monday was the start of a parabolic move. First Majestic Silver, the strongest performing Silver stock has already gone parabolic. Keep an eye on First Majestic to gauge or confirm movements in Silver. We still hold First Majestic in our premium service portfolio, which was originally recommended almost two years ago.
In our missive last Friday, we noted that Gold is close to embarking on another acceleration. Please see the chart below.
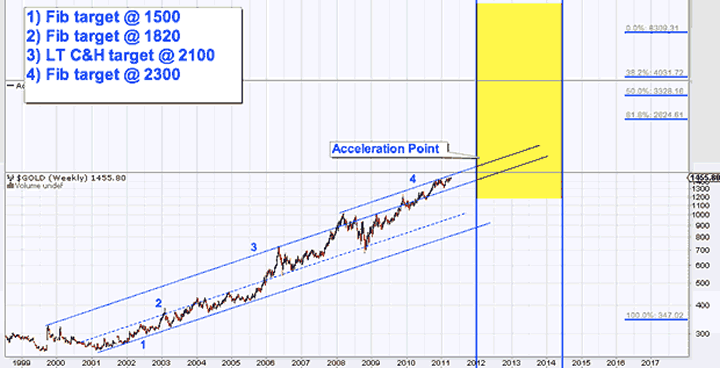
Gold began an initial acceleration in late 2005 and has gradually accelerated in the past 18 months. Over the next few months there is channel resistance from $1470-$1500 and $1500 marks an important Fibonacci target. If this is a real breakout then the market should surpass $1500 in the next few months. The strong targets are shown on the chart.
Over the weekend we studied various secular bull markets to get an idea of when markets begin to accelerate. It is easy to find the bubble but its more important to find that phase that leads to the bubble. In looking at a handful of bull markets we found that the typical acceleration begins in year 11 of the bull market and that after year 12 it is obvious the market has changed its character. Hence we are projecting a visible acceleration in 2012-2013.
Moving along, lets look at the gold stocks. Below is a chart of the Barrons Gold Mining Index that dates back to 1938. The index is current as of two days ago which means the index likely made a new all time high on Tuesday. A sustained move higher confirms a historic breakout past 31 year resistance.
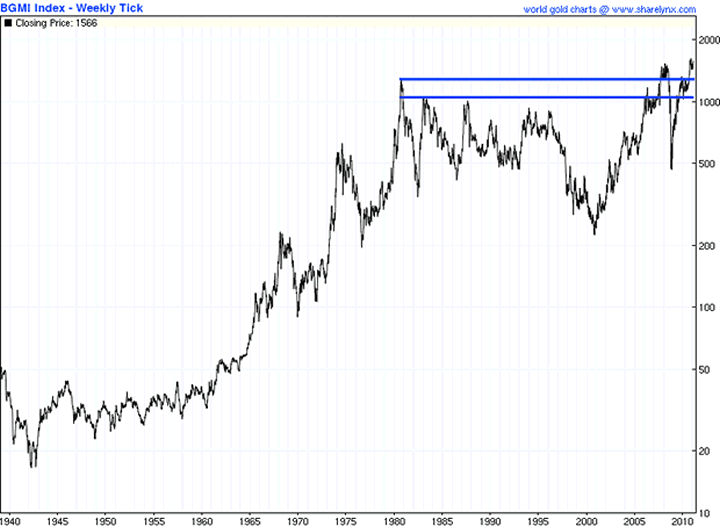
Right now all you need to know are two things. First, take a look at the above breakout. Second, consider the estimation that 1% of global assets and 0.30% of pension assets are allocated to Gold and gold shares. Folks, this is absolutely stunning. This is why this bull market will be the greatest bull market in generations. George Soros knows what he's talking about when he says, "Gold is the ultimate bubble."
The coming global debt crisis and currency crisis will wipeout some while enriching others. The smart money is positioned. Are you? For more analysis and guidance, consider a free 14 day trial to our service.
Good Luck!
Jordan Roy-Byrne, CMT
Trendsman@Trendsman.com
Subscription Service
Trendsman” is an affiliate member of the Market Technicians Association (MTA) and is enrolled in their CMT Program, which certifies professionals in the field of technical analysis. He will be taking the final exam in Spring 07. Trendsman focuses on technical analysis but analyzes fundamentals and investor psychology in tandem with the charts. He credits his success to an immense love of the markets and an insatiable thirst for knowledge and profits.
© 2005-2022 http://www.MarketOracle.co.uk - The Market Oracle is a FREE Daily Financial Markets Analysis & Forecasting online publication.