


Currency Analysis and Forecasts for Canadian Dollar, Euro, USD Plus Bonds and S&P
Stock-Markets / Financial Markets 2011 Apr 11, 2011 - 08:27 AM GMTBy: David_Petch

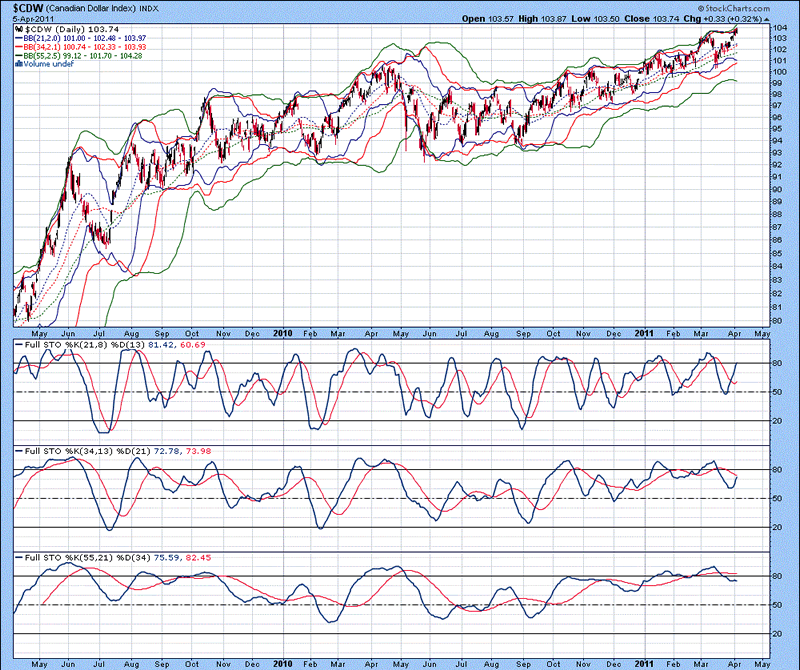
 The daily chart of the Canadian dollar index is shown below, with upper Bollinger bands all in close proximity to each other and the index, suggestive that further upside potential exists. The lower 21 and 5 MA Bollinger bands curling over also support further upside. Full stochastics 1, 2 and 3 are shown below in order of descent, with the %K above the %D in 1 and beneath the %D in 2 and 3. Notice how the %K in stochastic 2 curled up. The daily chart suggests at least 7-10 days of further upside before any sort of top is put in place. A high Canadian dollar is going to have a devastating impact on companies in Canada.
This is going to feed a productivity boom as every cent lost on the dollar requires at least another percentage increase in efficiencies to maintain a set earnings/share. To be frank, Canadian companies (remember I work for a Biotech company in Canada) were lazy and simply relied on a low Canadian dollar as a productivity boost. Now that this safety net has long been removed, this will cause productivity gains. This could really boost Canada as a global economic force...nothing like Germany or Japan, given our 34 million population base, but it will make a more competitive nation.
Figure 1
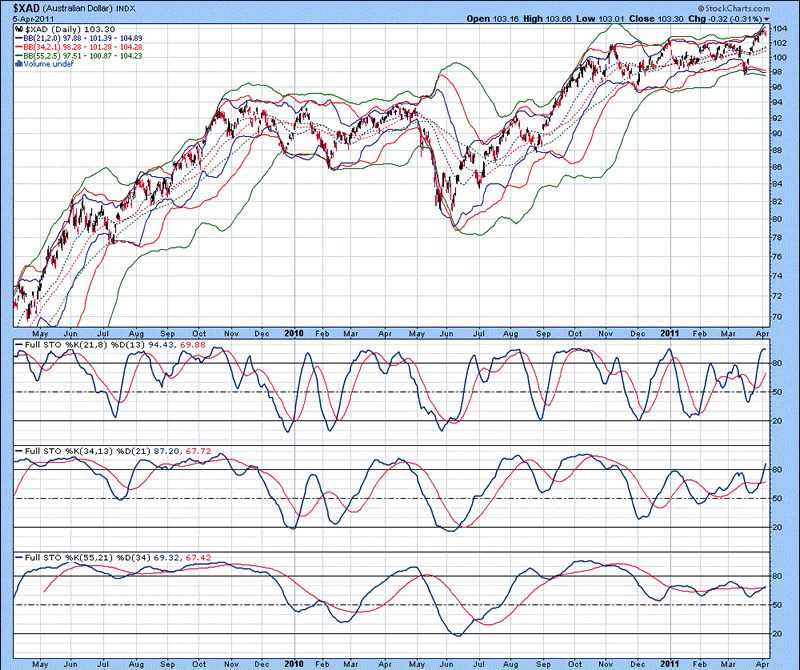
The daily chart of the Australian dollar index is shown below, with all three lower Bollinger bands in close proximity to each other, suggestive that 6-8 weeks of sideways to upward price action exists before a top is put in place. Upper Bollinger bands are riding the index higher, suggestive that further upside potential exists. Full stochastics 1, 2 and 3 are shown below in order of descent, with the %K above the %D in all three instances. Stochastic 3 shows a 3 month consolidation pattern just set to break out...this also does not bode well for Australian companies...A higher Canadian dollar is worse for Canada however, since some 80-85% of our global trade is with the US.
Figure 2
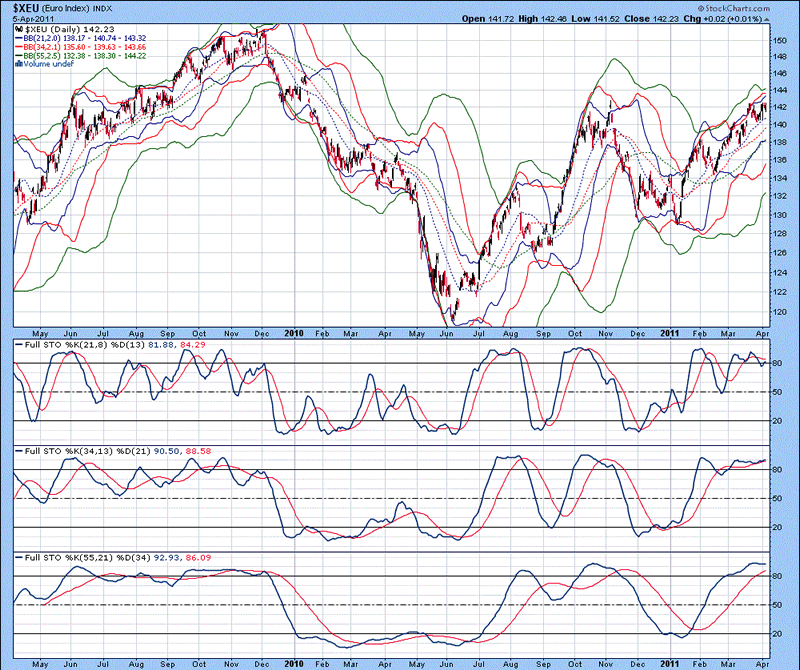
The daily chart of the Euro index is shown below, with upper Bollinger bands slightly above the index. Full stochastics 1, 2 and 3 are shown below in order of descent, with the %K beneath the %D in 1 and above the %D in 2 and 3. The Euro is struggling to move higher against the US dollar, which implies the recent weakness is being caused by strength in the Aussie and Canadian dollar indices. The Euro and US dollar are the globally hand bagged currencies at the moment, so expect to see the Aussie and Canadian dollars to continue to exhibit strength until June.
Figure 3
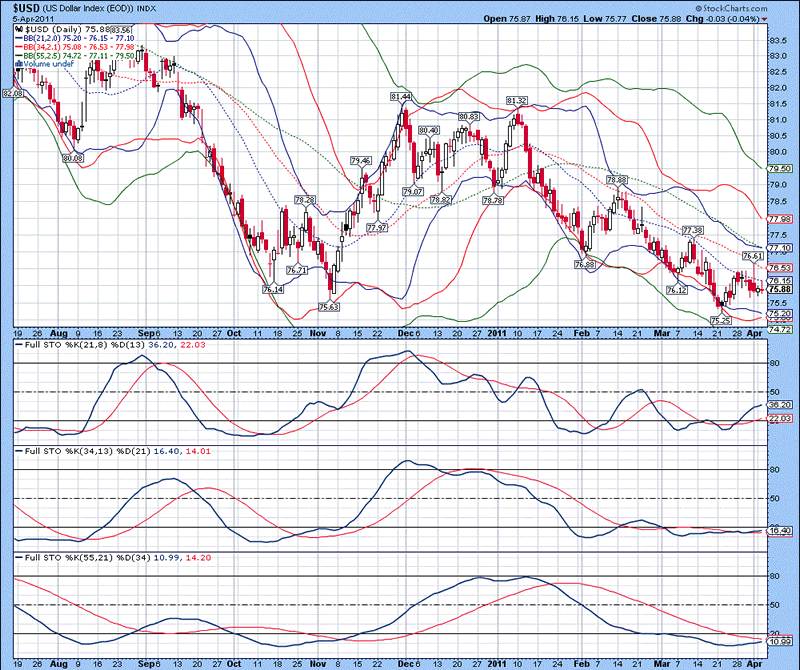
US Dollar Index
The daily chart of the US dollar index is shown below, with lower Bollinger bands in close proximity to the the recent closing price. Full stochastics 1, 2 and 3 are shown below in order of descent, with the %K above the %D in 1 and 2 and beneath the %D in 3. The USD continues to try and put in a bottom, but it will likely continue to base for the next 6-8 weeks.
Figure 4
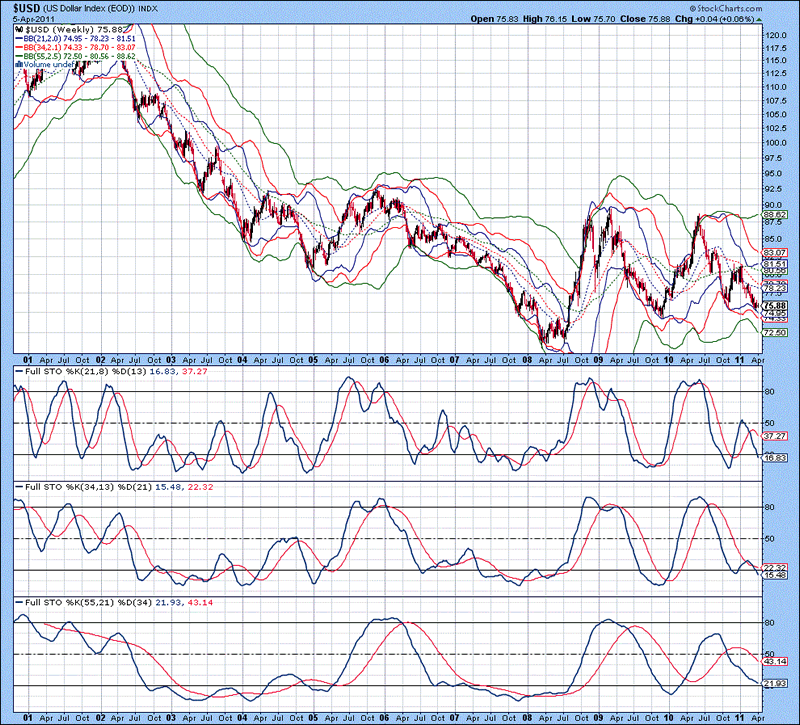
The weekly chart of the USD index is shown below, with lower 21 and 34 MA Bollinger bands in close proximity to the recent close. The upper 55 MA Bollinger band has curled up, indicating that further downside exists. Full stochastics 1, 2 and 3 are shown below in order of descent, with the %K beneath the %D in all three instances. The weekly chart clearly indicates that further weakness exists for at least the next 6-8 weeks...within this time frame, a bottom could be put in place.
Figure 5
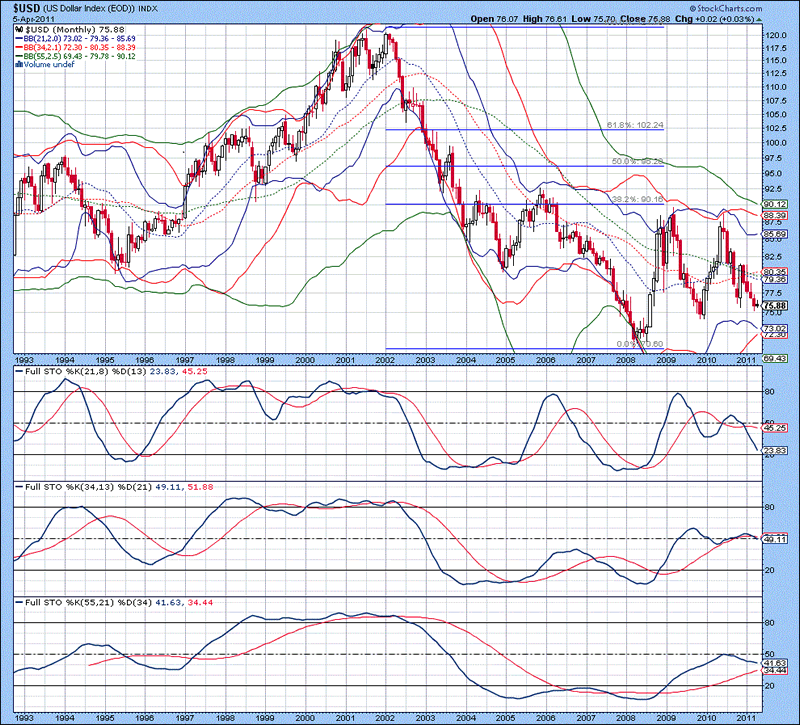
The monthly chart of the US dollar index is shown below, with lower 21 and 34 MA Bollinger bands in close proximity to each other. Full stochastics 1, 2 and 3 are shown below in order of descent, with the %K beneath the %D in 1 and 2 and above the %D in 3. The monthly chart for the dollar is rather bearish...the Elliott Wave count suggests a turnaround in early to mid June, but sustained weakness and a move below the 2008 lows would invalidate the count.
Figure 6
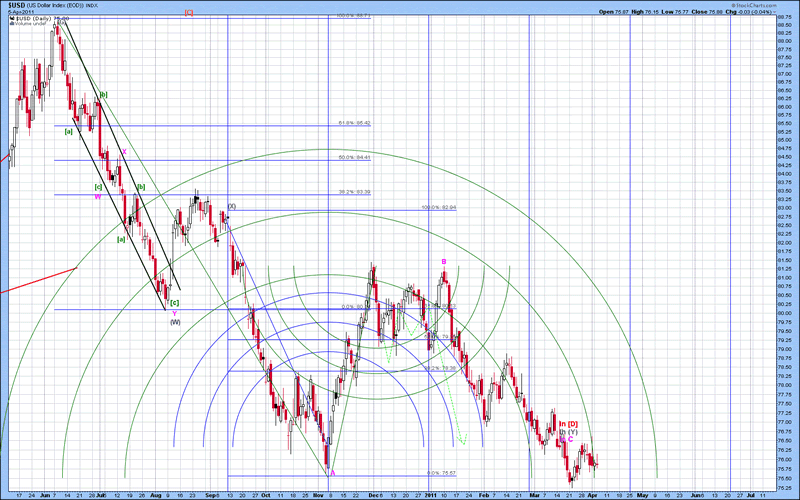
The short-term Elliott Wave count of the S&P 500 index is shown below, with wave C.(Y) underway at present. Wave A.(Y) was clearly impulsive, so wave C.(Y) must also be impulsive in nature, based upon rules of Elliott Wave. So far, wave C continues to grind lower, trying to establish a bottom.
Figure 7
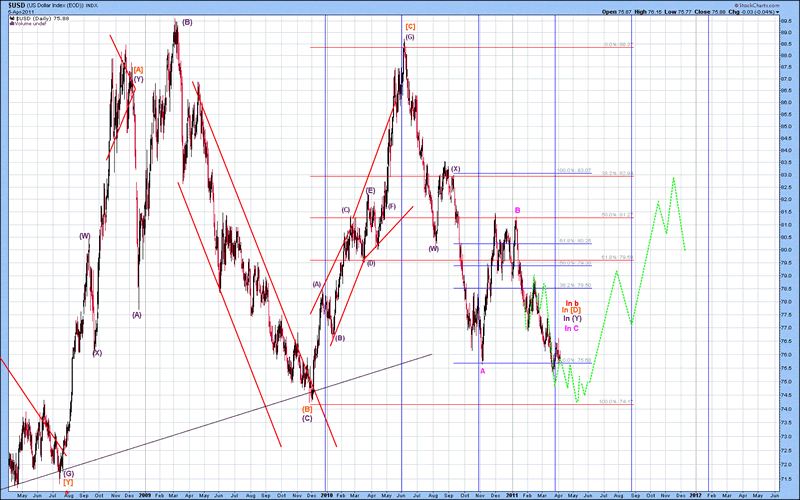
The mid-term Elliott Wave count of the S&P 500 index is shown below, with the thought pattern forming shown in green. Unlike the S&P 500 index count, the USD index is conforming to the hypothesized count. A larger degree triangle is forming, with wave [D] currently forming and wave [E] still yet to form. If true, the USD should rise to at least the 81-82 level from June until December 2011-February 2012 before declining in a sharp pattern to at least the 65-67 area...this is a conservative target and it could go lower. IF this occurs, it will put the global economies into a recession, just when governments and pension funds need a ton of money to pay things off. Gold will be the thing to hold for 2012, along with related stocks because tangible items always do well with rising interest rates. A rush out of bonds will begin...the big rush will be near the latter half of 2012 when people see their “safe holdings” have depreciated substantially. When a bottom in the USD occurs, the USD will rise as a short-term wave of deflation hits, which will send commodity prices reeling...there will be a time to sell out on commodity stocks and stocks in general and that will be when the USD bottoms after its coming decline (after it hits 81-83).
Figure 8
That is all for today...back tomorrow with an update. I will update the 10 Year US Treasury Index tomorrow and gold and gold-related ratios on Friday.
Have a great day...I am still putting a list of natural gas stocks together. When I finish compiling this list on the weekend, remember that gas prices in North America are going to have to rise. Other countries are paying 3x more than we are in North America. Prices for heating homes in Canada with natural gas can be $400-500/month in the dead of winter when priced at $10/mcf so this really removes disposable income...more about this towards the end of the week.
By David Petch
http://www.treasurechests.info
I generally try to write at least one editorial per week, although typically not as long as this one. At www.treasurechests.info , once per week (with updates if required), I track the Amex Gold BUGS Index, AMEX Oil Index, US Dollar Index, 10 Year US Treasury Index and the S&P 500 Index using various forms of technical analysis, including Elliott Wave. Captain Hook the site proprietor writes 2-3 articles per week on the “big picture” by tying in recent market action with numerous index ratios, money supply, COT positions etc. We also cover some 60 plus stocks in the precious metals, energy and base metals categories (with a focus on stocks around our provinces).
With the above being just one example of how we go about identifying value for investors, if this is the kind of analysis you are looking for we invite you to visit our site and discover more about how our service can further aid in achieving your financial goals. In this regard, whether it's top down macro-analysis designed to assist in opinion shaping and investment policy, or analysis on specific opportunities in the precious metals and energy sectors believed to possess exceptional value, like mindedly at Treasure Chests we in turn strive to provide the best value possible. So again, pay us a visit and discover why a small investment on your part could pay you handsome rewards in the not too distant future.
And of course if you have any questions, comments, or criticisms regarding the above, please feel free to drop us a line . We very much enjoy hearing from you on these items.
Disclaimer: The above is a matter of opinion and is not intended as investment advice. Information and analysis above are derived from sources and utilizing methods believed reliable, but we cannot accept responsibility for any trading losses you may incur as a result of this analysis. Comments within the text should not be construed as specific recommendations to buy or sell securities. Individuals should consult with their broker and personal financial advisors before engaging in any trading activities as we are not registered brokers or advisors. Certain statements included herein may constitute "forward-looking statements" with the meaning of certain securities legislative measures. Such forward-looking statements involve known and unknown risks, uncertainties and other factors that may cause the actual results, performance or achievements of the above mentioned companies, and / or industry results, to be materially different from any future results, performance or achievements expressed or implied by such forward-looking statements. Do your own due diligence.
Copyright © 2011 treasurechests.info Inc. All rights reserved.
Unless otherwise indicated, all materials on these pages are copyrighted by treasurechests.info Inc. No part of these pages, either text or image may be used for any purpose other than personal use. Therefore, reproduction, modification, storage in a retrieval system or retransmission, in any form or by any means, electronic, mechanical or otherwise, for reasons other than personal use, is strictly prohibited without prior written permission.
David Petch Archive |
© 2005-2022 http://www.MarketOracle.co.uk - The Market Oracle is a FREE Daily Financial Markets Analysis & Forecasting online publication.