


Gold and Silver, NUTS to all of you ‘Top Pickers!’
Commodities / Gold and Silver 2011 May 03, 2011 - 01:52 AM GMTBy: Peter_Degraaf

 “What is the meaning of a gold standard and a redeemable currency? It represents integrity. It insures the people’s control over the government’s use of the public purse. It is the best guarantee against the socialization of a nation. It enables a people to keep the government and banks in check. It prevents currency expansion from getting ever farther out of bounds until it becomes worthless. It tends to force standards of honesty on government and bank officials. It is the symbol of a free society and an honorable government. It is a necessary prerequisite to economic health. It is the first economic bulwark of free men”. W. E. Spahr.
On a daily basis I receive Emails that consist of a lament, citing analysts who are predicting a major top in the metals, to occur almost imminently. They quote a man who runs a financial website and who a few weeks ago, drew a line in the sand for silver at $37.00. They also mention Robert Prechter as having told his clients that he was selling silver at 37.37. I was surprised to learn that Prechter had any silver, since he told his subscribers in 2002 that he had just shorted gold at $400.00 and expected to cover at $50.00. Since he is still waiting for gold to drop to $50.00, why would he own silver? This is the same Robert Prechter who in the mid-1980’s predicted a peak for the DOW at 4000 to be followed by a crash. Instead the DOW rose to 11000. “Nuts” to these and other analysts who fail to realize that silver is in a bull market like no other.
General Anthony Clement "Nuts" McAuliffe (July 2, 1898 – August 11, 1975) was the United States Army general who commanded the 101st Airborne Division troops defending Bastogne, Belgium during the Battle of the Bulge in World War II. He is famous for his single-word reply to a German surrender ultimatum: "Nuts!"
After the Battle of the Bulge, McAuliffe was given command of his own division, the 103rd Infantry Division of the US 7th Army, which he led from January 15, 1945, to July 1945.
I’d like to take a page from General McAuliffe and say ‘nuts’ to all those who are warning their readers not to buy gold and silver because they think that the ‘top is in’. Sure, silver may (or maybe not?) need a few weeks to climb above the magical $50.00 level, just as gold took its time to rise above $1,450.00; but $50.00 silver today does not mean the same thing as $50.00 silver in 1980.
(Readers in Canada and Great Britain can find inflation calculators by using a search engine and typing in ‘inflation calculator.’)
Obviously the barrier these ‘silver-negative’ advisers need to be concerned about is not $50.00 but $451.45.
Then there are those who warn of a price decline between May and September. While it is true that this is the time of year when jewelry demand worldwide is at its lowest as many jewelers take holidays, the adage ‘sell in May and go away’ did not work for silver during 2009 and 2010 (see next chart), and may not work this year due to positive fundamentals.
The charts in this essay are courtesy Stockcharts.com unless indicated. This chart shows selling on May 1st followed by a purchase after Labor Day in 2009 and 2010 would have produced a loss.
• According to the Silver Institute in a report “The future of Silver Industrial Demand”, industrial usage by 2015 is expected to total 667 million ounces. Industrial use for silver in 2010 was 487 million ounces. This represents an expected annual increase of 7.4%. In 1990 industrial demand was 273 million ounces. In the past 20 years demand is up 78%.
• There are a number of new applications for silver including food packaging, RFID tags (this could be BIG), auto catalysts, electrical contacts in automobiles, solar energy (this too could be BIG).
• According to Goldcorp.com the demand for silver from Solar Panels is expected to reach 2,000 tonnes by 2011. This represents 7% of the world output! (One tonne of silver = 32,273.96 ounces).
• The big driver at the moment is investor demand, as coin shops and bullion dealers are hard pressed to keep up with demand and the price for physical silver carries a sizeable premium over the ‘paper-digital’ silver price that is reported by the COMEX.
• The bullion banks that stupidly shorted millions of ounces of silver are facing margin calls that collectively total billions of dollars. We are seeing signs that these banks are trying their utmost to cover these short positions without causing price to run too far ahead of them. (For evidence of the most recent attempt by the bullion banks to suppress the silver price visit today’s silver chart at www.kitco.com).
• Demand for silver from China keeps on increasing. In January the major bullion bank in China sold as much as it had sold in the first three months of 2010.
• According to an article at Infomine.com by Shivom Seth quoting bullion dealers in Mumbai, investors in India are hoarding the white metal. Demand is expected to jump by 10% - 15% from the current level of about 3,000 tonnes a year.
• Eric Sprott in Canada was quoted recently while commenting upon his purchase of silver bars for the silver trust PSLV, “all we saw coming in was brand new bars – it looked like they came fresh from the mines.”
• We have not yet seen silver users scramble for supply in an effort to stock up before price rises even higher. This is likely to occur once the $50.00 level is conquered.
This chart shows the price of silver at week’s end to be at or near the top of the weekly range, for the past six weeks. Although the supporting indicators are presently at resistance levels, a return to the support line at the green arrow will cause me to add to existing long positions. A strong close above the blue arrow (ideally after some oscillation between $45.00 and $50.00), will set up a price target at $451.45. (This target will advance as time goes by, due to price inflation).
“When national debts have once accumulated to a certain degree, there is scarce, I believe a single instance of their having been fairly and completely paid. The liberation of the public revenue if it has ever been brought about at all, has always been brought about by a bankruptcy, sometimes by an avowed one but always by a real one, though frequently by a pretended payment.” Adam Smith.
This chart courtesy Cotpricecharts.com shows a drop in the ‘net short’ position of commercial silver traders (purple bar). This drop is the largest drop in years, from 53,000 to 43,000! This is very bullish as it shows us that the commercial traders do not believe silver is topping out, or they would be selling into it. The next largest drop (from 57,000 to 48,000), occurred in February 2010 and silver then rose from $15.51 in February to $19.34 in the next three months – an increase of 25%! The next COT report is due out on Friday May 6th and is expected to be even more bullish, due to the raid on silver taking place May 2nd.
“The greatest profits will be made by the long-term investor without margin, who is there when gold goes to four figures. Trading is a game won by a few, but lied about by many.” James Sinclair.
And what about gold?
“You have a choice between the natural stability of gold and the honesty and intelligence of the members of government. And with all due respect for those gentlemen, I advise you, as long as the capitalist system lasts, vote for gold." George Bernard Shaw.
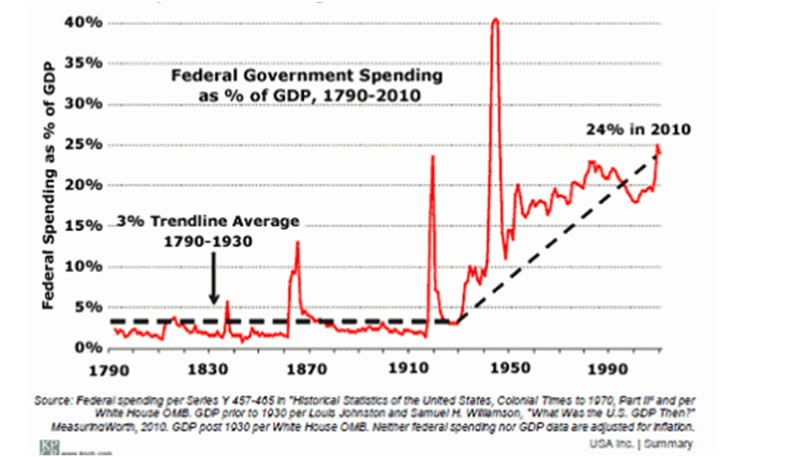
This chart courtesy KPCB.com shows current US federal government spending compared to GDP is at the highest level in over 200 years except for WW2. One of the drivers behind a rising gold price is the collapse of public confidence in leadership.
Featured is the daily bar chart for gold. Price is in a solid uptrend after the recent breakout above $1500. Because the supporting indicators are nearing resistance levels, the expectation is for price to oscillate between the two arrows for a few days while the indicators release some pressure, but because of bullish fundamentals (paper printing at Bernanke and Co., outpacing gold production by 10 to 1), the bull market is expected to continue, for many years.
“That which has been is what will be. That which is done is what will be done, and there is nothing new under the sun.” King Solomon 940 BC. Ecclesiastes 1:9.
This chart courtesy Cotpricecharts.com shows the ‘net short’ position among commercial traders (purple bar) has dropped from 267,000 the previous week to 249,000 this past week. This tells us that commercial traders do not expect a top during the next few weeks; otherwise they’d be piling on the short positions.
Featured is the gold price in Canadian dollars. Price rose to a new high Friday and closed near the top of the daily range. In the event of a test of the breakout at 14.40, the arrow points to support. The 50D is in positive alignment to the 200D (green oval), and both are rising.
Featured is the gold price in Euros. Price is carving out a small ARAT formation. A breakout at the blue arrow turns the short-term quite bullish.
“Banking was conceived in iniquity and born in sin. Bankers own the earth; take it away from them but leave them with the power to create credit; and, with a flick of a pen, they will create enough money to buy it back again. Take this power away from them and all great fortunes like mine will disappear, and they ought to disappear, for then this world would be a happier and better world to live in. But if you want to be slaves of bankers and pay the cost of your own slavery, then let the bankers control money and control credit." 1940, Sir Josiah Stamp, Director of the Bank of England.
Featured is the GLD gold ETF. Price has risen 11 out of the last 12 days and Friday it produced the best jump of all. Volume is supporting the rise (green arrow). The supporting indicators are positive but at resistance. Technically a pullback is due, but strong fundamental pressure could very well delay or cushion a pullback.
Featured is the index that compares gold to bonds. Price rose to a new all-time high Friday, after having been in a bull market since 3.00 in 2002 (see next chart). Ever since then gold has outperformed bonds (‘stuff beating fluff’). Every breakout causes more people to give up on bonds and turn to gold.
Featured is the long term look at the same index. Gold has outperformed bonds by 400% in 11 years.
Featured is the PHYS gold trust. Price has broken out from the year old resistance area and volume is supportive (green box). The green arrow points to support in the event of a test. The target for this breakout is 16.00. Owning part of an audited trust guarantees the gold is there to back up the shares - many ETFs do not offer such a guarantee.
Something smells! On Sunday afternoon, May 1 at 4.43 PM Marketwatch sent out an alert (alerts@marketwatch.com) with this notice:
LOS ANGELES (MarketWatch) – “Silver prices fell sharply in early Monday trading in Asia, with the spot price plunging more than 10% in a matter of minutes, according to Kitco data”. This alert quotes Kitco data, but Kitco on Sunday does not report data until 6 PM, NY time! Could it be that someone provided Marketwatch with a ‘heads up’ that a raid would take place in the thinly traded market in Sydney, Australia on Sunday evening?
Happy trading!
By Peter Degraaf
Peter Degraaf is an on-line stock trader with over 50 years of investing experience. He issues a weekend report on the markets for his many subscribers. For a sample issue send him an E-mail at itiswell@cogeco.net , or visit his website at www.pdegraaf.com where you will find many long-term charts, as well as an interesting collection of Worthwhile Quotes that make for fascinating reading.
© 2011 Copyright Peter Degraaf - All Rights Reserved
DISCLAIMER: Please do your own due diligence. I am NOT responsible for your trading decisions.
Peter Degraaf Archive |
© 2005-2022 http://www.MarketOracle.co.uk - The Market Oracle is a FREE Daily Financial Markets Analysis & Forecasting online publication.