


Weekly Gold and Silver Technical Analysis Report - Caution !
Commodities / Forecasts & Technical Analysis Jan 30, 2007 - 10:12 PM GMTBy: Merv_Burak

Only two up days with three down days but still ending on the plus side. Gold is up against a strong resistance barrier. Will it break through? Ah! The mysteries of life.
GOLD - LONG TERM
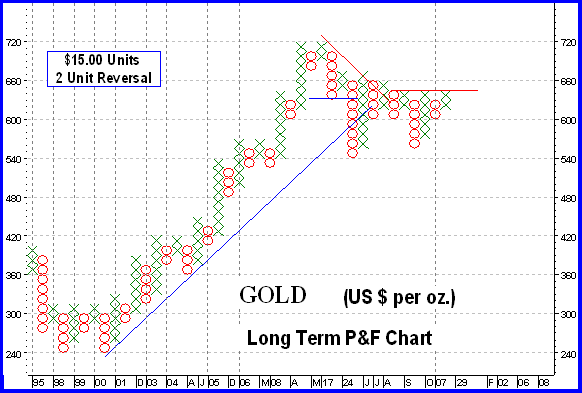
Well here we are with that long term P&F chart. As you can see gold is up against two previous attempts to breach the $645 level (requiring $660 per the P&F ). At the present time it's touch and go. I will be changing the contract month for obtaining my gold trading data from Feb to April. This will bring the break-out closer so we should be careful if we then get a very mild break-out. Wait for a move above the next level (requiring $690) to really confirm a break. Of course if the action does not break out anytime soon then the initial resistance becomes a valid break-out point. Should it break out soon then a P&F count would give us a projection to the $720 level, i.e. the previous top. The more positive break-out and projection would be that at $690 which would take us to at least the $915 area. For now, the last signal remains the bear signal of a few months back.
As for the usual suspects, the long term indicators and trend remain in what I would still call a neutral level. Although the past week's action has been above the long term moving average line that line, although sloping very slightly upwards, has been in a basic lateral trend weaving up and down with the volatility of the wide lateral price action. The same can be said about the momentum indicator. It has remained in the positive zone but has been moving in a basic lateral direction just above its neutral line. There is still no indication of a major STRONG move in progress. Although we have had some good volume days recently the volume indicator is really no different than the other indicators, sometimes positive and sometimes negative but with no real conviction. If I was to place any conviction on it, it would be slightly towards the negative although it has crossed its long term trigger line to the upside this past week.
On the long term I will remain as per last week, maintaining a bearish position but what may be a more appropriate neutral rating.
INTERMEDIATE TERM
The intermediate term P&F chart moved below two previous lows in early Jan for the first of my two events necessary to provide a reversal signal. It stopped just short of the other event, i.e. breaking below its up trend line. It bounced off the up trend line and is once more firmly in a congestion area but close to an upside break.
As for the usual indicators, the action during the past week continued above a positive sloping moving average line. Momentum continued in its neutral action not going anywhere in particular and the volume action was interesting. Here we have had a continued improving daily volume action but the indicator itself still was going no where. The volume seems to be dispersed between both up days and down days although the up days do have a mild advantage, not enough to make anything out of it, however.
I went neutral last week and will remain so this week. There is nothing in the on going action to get enthusiastic one way or the other, yet.
SHORT TERM
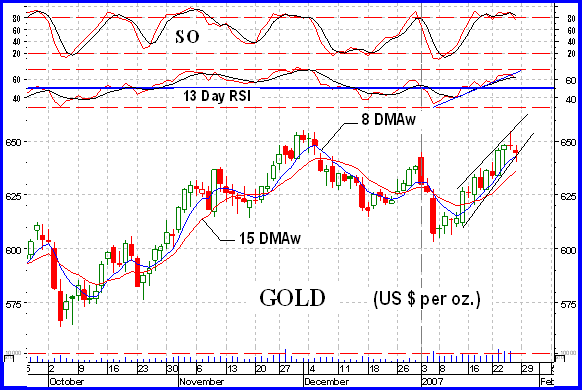
Well, the short term rally continued throughout the week despite a few down days. It does look to be in the beginnings of a reversal with the action of Thursday indicating a potential one day reversal action. We have an aggressive upward sloping wedge pattern which can only result in a break on the down side. Momentum has been moving higher but is looking like a reversal also. Momentum has dropped below an aggressive up trend line and has just moved oh so slightly below its moving average trigger line for a trend direction cautionary signal. We see the price itself still well above a positive moving average line (15 DMAw). Everything could change should the price quickly close below the $640 level so be on guard.
All in all, the short term trend is still positive so one would remain bullish from the short term perspective but there are too many signs of a potential reversal just ahead to be glowingly bullish. Watch that $640 level.
IMMEDIATE TERM
Okay, where is that coin? On the immediate term the price looks like it might just break below the bottom wedge trend line and below its very short term moving average line (8 DMAw). That moving average line has already started its turn towards the negative although it has not fully turned yet. The aggressive Stochastic Oscillator (SO) had been in its overbought zone and is once more below the overbought line. It has also dropped below its trigger line and below the previous low set a few days back. Although the price is still slightly above its moving average line I would say we are into some negative action over the next few days. How far such action will go is anyone's guess. It may or may not trigger a short term reversal. I would be inclined to suggest that we are in for a move back to at least the $605 level but let the action tell us which way it is going.
NORTH AMERICAN GOLD INDICES
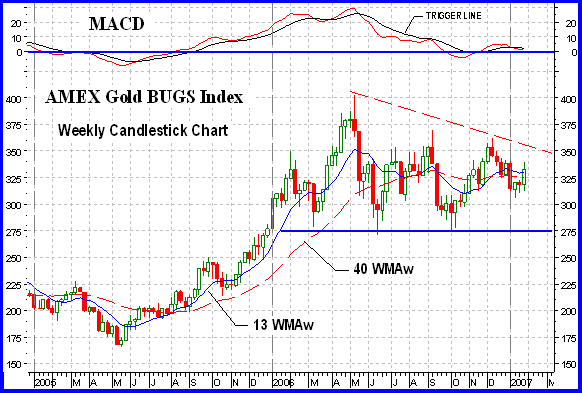
We're back to the AMEX Gold BUGS Index this week, as far as the majors are concerned. Of the four major North American Indices that I look at in this section this Index is probably the most aggressive, although the AMEX Gold Miners Index may eventually take that place (check out the Merv's Gamb-Gold Index below for a comparison of aggressive Indices). The continuing lateral trend can be clearly seen here. We still have a potential head and shoulder pattern with an elongated right shoulder but as time goes by it looks like a new pattern developing that has a bullish emphasis to it. This one will still take a little more time but the next major market direction move will be seen following the breaking of either the upper dashed down trend line or the head and shoulder support neckline. We await with anticipation one or the other.
The MACD indicator (Moving Average Convergence/Divergence) shown this week was actually developed as part of an overall trading technique not as an individual indicator but the industry has jumped on it as a simple momentum indicator and it has become probably the most popular indicator since. I have my own favorite but it is instructive to show a variety of indicators over time. The MACD is showing significant weakness in the latest action since October. Whether this will continue into a trend reversal still remains to be seen. It is not, however, a good omen. The same weakness is shown in my favorite, the RSI (Relative Strength Index). Some analysts may provide analysis showing that the next move is a sure bull move or a sure bear move. For now it is a dull boring waiting game. Try not to get ahead of the action by assuming which way it will go. Wait for the trend to take hold and then you can jump in with greatly reduced risk of loss.
MERV'S PRECIOUS METALS INDICES
It was another good week for the Merv's Indices with gains in the neighborhood of 4% to 7%, give or take a few decimal % points. The major North American Gold Indices had gains between 4.2% and 4.5%. It seems that everything was up on the week, even the US $ Index. I thought the $ was supposed to move counter to gold. Oh well, we'll see what tomorrow brings.
The Composite Index of Precious Metals Indices is still in a positive mode but showing weakness. Despite a good positive week for the composite its momentum indicator had barely moved. Something not too great under all that positive activity that needs to be watched. It may be another few weeks before the action will tell us one way or the other which way it really wants to go.
MERV'S GOLD & SILVER 160 INDEX
With the average universe stock advancing by 4.3% on the week that was about what the majors did. The Index has closed above both its intermediate and long term moving average lines and both lines are sloping upwards. Both momentum indicators are in positive territory although both are showing some under performance versus the performance of the Index. Both time periods may be rated as bullish until otherwise verified.
As for the breadth of the market action of these 160 stocks, 78% advanced on the week while only 19% declined. As for the overall individual stock ratings, they all improved during the week. On the short term we are now at a BULL 62% (bear 55% last week), on the intermediate term we are at a BULL 53% (bear 57% last week) and on the long term we are at a BULL 58% (bull 51% last week). So, for all time periods we have a majority bullish rating for the stocks which goes with a bullish indicator analysis.
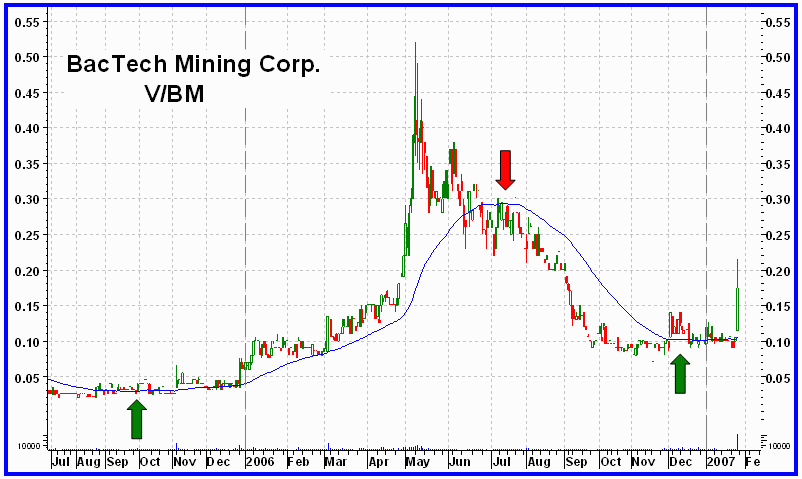
Although everything looks great we are still not into an overly greedy period. Only one stock met my arbitrary plus/minus over 30% weekly move this week. BacTech Mining Corp . advanced 66.7% on the week. Looking back through my tables of technical information and ratings BacTech turned POS in my intermediate term ratings (my preferred time period) back on 08 Dec 2006 and has been POS ever since. There was a lot of time to have gotten in for those following the ratings. Although the technical information and ratings suggested something happening back in Dec it was only after the announcement of a Uranium joint venture on Friday that the real move occurred. Thinking in terms of speculation, there may still be a lot more upside ahead for this “penny” stock, after all we did have a 600% move last year and these speculators must still be around for another try at it.
MERV'S QUAL-GOLD INDEX , MERV'S SPEC-GOLD INDEX , MERV'S GAMB-GOLD INDEX
A good week was had by all, especially the Gamb-Gold Index which had a gain of 6.4% vaulting it into new all time high territory (see chart). Compare this performance to the AMEX Gold BUGS Index above. The Merv's Gamb-Gold Index reflects the AVERAGE weekly performance of the 30 component stocks in the Index.
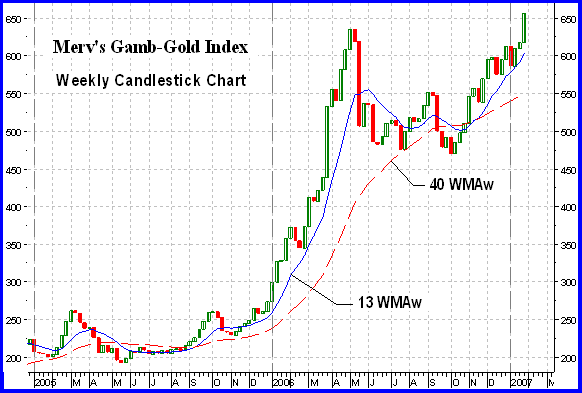
For all three Indices the Indices are above their positive sloping intermediate and long term moving average lines, however, only for the Gamb-Gold Index is the intermediate term line slope already quite aggressive. For the other two the line slope is only slightly tilted upwards. For the Qual & Spec-Gold Indices their intermediate and long term momentum indicators are positive but still in a lateral trend not having exceeded their recent highs. The Gamb-Gold momentum, however, is looking good for both periods having moved aggressively through its previous lateral trending activity. The intermediate term momentum is even very close now to its overbought zone.
All three Indices may be rated as bullish for both time periods but only the Gamb-Gold Index is comfortably so.
As for the breadth of the market of these Indices, their advancing/declining issues were the best for the Qual Index and became slightly less so as we went down in quality. The Qual had 93% advancing, the Spec had 77% advancing and the Gamb had only 67% advancing (but these 67% did a whole lot better advancing job). To summarize the overall individual stock ratings, for the short term we have the Qual at BULL 78% (last week bear 67%), the Spec at BULL 62% (last week bear 55%) and the Gamb at BULL 62% (last week bull 50%). For the intermediate term we have Qual at BULL 58% (last week bear 58%), the Spec at NEUTRAL (last week bear 67%) and Gamb at BULL 62% (last week neutral). For the long term we have Qual at BULL 73% (last week bull 50%), Spec at BULL 67% (last week bull 62%) and Gamb at BULL 70% (last week bull 58%).
As noted, all precious metal sectors (combined gold and silver sectors) are in bullish trends but only the gambling stocks seem to be comfortably so.
SILVER
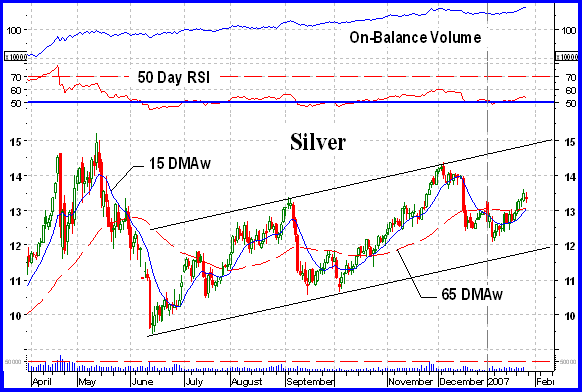
Silver continues to be trapped in that wide up trending channel. It is in the middle and can go either way from here but it is in a positive short term trend and as long as it remains above its short term moving average line (15 DMAw) and the line remains sloping upwards, there is no problem. The intermediate term momentum confirms the price trend by making higher lows and higher highs along with the price, but at a lethargic rate. The volume also confirms the positive nature of the price trend by continually making higher levels. This may be suggesting that speculators are more enamored with silver than with gold as the gold chart does not show the same positive volume trend. If you were going to go with either gold or silver, silver looks like the better bet at this time.
MERV'S QUAL-SILVER INDEX
With only 10 component stocks this Index, more than any of the other Merv's Indices, can be quite volatile. This week's gain of 6.8% was the best of the Merv's Indices, actually the best of all the Precious Metals Indices, with all 10 component stocks closing on the up side. Even so it is still not at new all time highs, close but not quite there. Although the Index action is above the level of last April/May the momentum indicator is showing much lower strength levels. Still all the indicators are in positive territory so we go with the flow.
MERV'S SPEC-SILVER INDEX
Usually the Spec-Silver Index is the one leading the pack but this week it just equaled the gain of the overall universe, at 4.4%. The Index has moved above recent action but is still below its level from last April/May. With 72% of the component stocks advancing and 28% declining the ratings have improved versus last week. On the short term we are at BULL 62% (last week neutral), on the intermediate term BULL 60% (last week bear 54%) and on the long term BULL 72% (last week bull 58%).
All in all the two strongest groups are the Merv's Gamb-Gold and Merv's Spec-Silver Indices, the more aggressive gambling kind of stocks.
MERV'S PRECIOUS METALS INDICES TABLE
Well that's it for this week (ending 26th Jan 07).
By Merv Burak, CMT
During the day Merv practices his engineering profession as a Consulting Aerospace Engineer. Once the sun goes down and night descends upon the earth Merv dons his other hat as a Chartered Market Technician ( CMT ) and tries to decipher what's going on in the securities markets. As an underground surveyor in the gold mines of Canada 's Northwest Territories in his youth, Merv has a soft spot for the gold industry and has developed several Gold Indices reflecting different aspects of the industry. As a basically lazy individual Merv's driving focus is to KEEP IT SIMPLE .
To find out more about Merv's various Gold Indices and component stocks, please visit www.themarkettraders.com and click on Merv's Precious Metals Central . There you will find samples of the Indices and their component stocks plus other publications of interest to gold investors. While at the themarkettraders.com web site please take the time to check out the Energy Central site for the most comprehensive survey of energy stocks on the internet. Before you invest, Always check your market timing with a Qualified Professional Market Technician
© 2005-2022 http://www.MarketOracle.co.uk - The Market Oracle is a FREE Daily Financial Markets Analysis & Forecasting online publication.