


Stock Market Crash or Meltdown Possible Within Next 2 Weeks
Stock-Markets / Financial Crash Jun 13, 2011 - 12:47 PM GMTBy: Steven_Vincent

 There are significant signals in the current market that a crash or meltdown scenario could unfold sometime in the next 1-2 weeks. Crashes are rare events and nearly impossible to predict, but many elements that could combine to produce a financial market calamity appear to be present at this time.
The video below reviews the current technical condition of the major world stock markets. In it I examine each index in terms of the relationship between price and the uptrends from March 2009 and August/September 2010, the April 2010 top and March 2011 low, the 20, 50 and 200 Exponential Moving Averages and areas of significant horizontal support/resistance.
Every major stock market in the world is either hovering just above or directly upon or has already broken a critical area of technical support. Ordinarily this might represent a major buying opportunity. But the current market setup may be anything but ordinary. In fact it may be quite extraordinary.
By moving dramatically ahead of the markets and leading price lower, the market's underlying technicals tend to indicate that a sharp break to the downside is imminent. Many indicators have led the market lower and now price will likely play catch up to the underlying technical condition of the market. Here is just one of many examples:
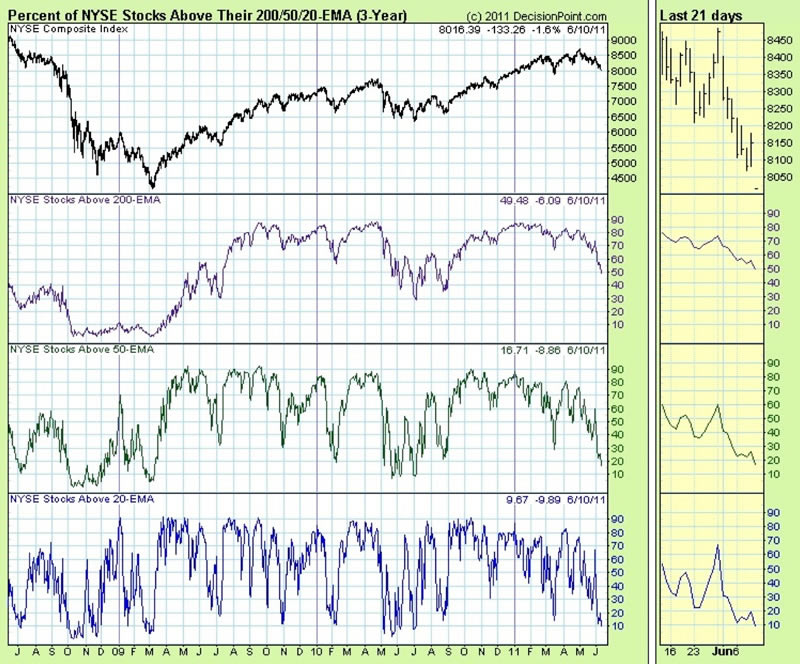
In spite of a very modest 7.5% decline over 6 weeks of trading (1.25% per week), Percent of Stocks Above the 20, 50 and 200 EMA have declined to precipitous lows usually associated with huge selloffs. This is a prime example of the technicals leading the market lower.
Many analysts are calling this a signal of an oversold market. I think they are wrong. To be oversold you need to see some capitulation selling and some fear and we have not seen that. Remember, crashes and capitulations generally come from oversold conditions.
VIX has barely budged:
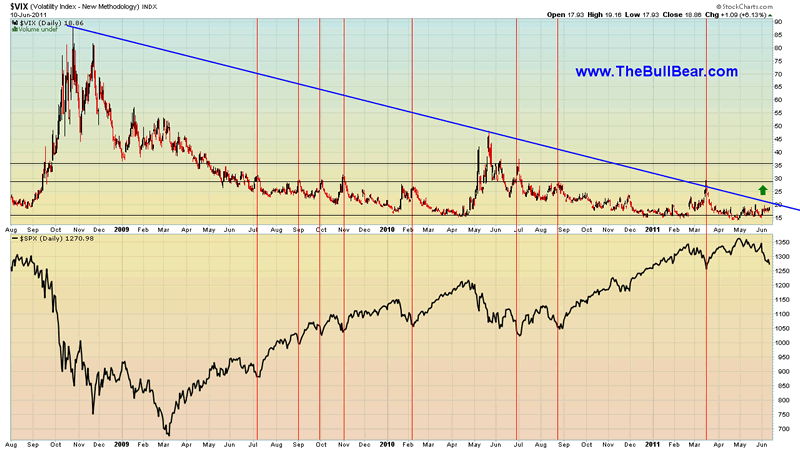
This technical evidence tells me that the selling HAS NOT EVEN STARTED YET. And it is likely to get started soon. There is MUCH more technical evidence that supports what I am saying here which will be published in a report for BullBear Traders members.
This is why I called for a possible crash. When you have a situation where price needs to play catch up to the underlying technicals and market participants are not fearful and are still buying the dip, you have the recipe for a crash.
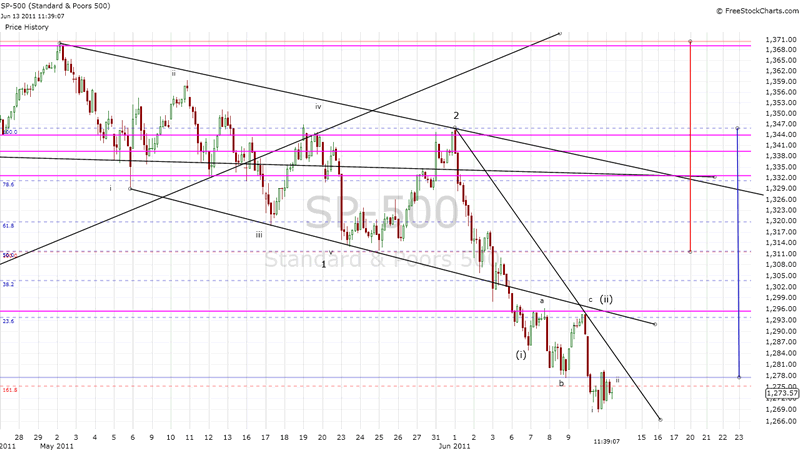
Today's weak bounce is probably just another selling opportunity. Unless the short term downtrend from the June high is broken, we have a iii of (iii) of 3 of C setup, which is a very bearish place to be.
To read the full BullBear Market Report, please join us at BullBear Traders room at TheBullBear.com.

Disclosure: No current positions.
By Steve Vincent
Steven Vincent has been studying and trading the markets since 1998 and is a member of the Market Technicians Association. He is proprietor of BullBear Trading which provides market analysis, timing and guidance to subscribers. He focuses intermediate to long term swing trading. When he is not charting and analyzing the markets he teaches yoga and meditation in Los Angeles.
© 2011 Copyright Steven Vincent - All Rights Reserved Disclaimer: The above is a matter of opinion provided for general information purposes only and is not intended as investment advice. Information and analysis above are derived from sources and utilising methods believed to be reliable, but we cannot accept responsibility for any losses you may incur as a result of this analysis. Individuals should consult with their personal financial advisors.
© 2005-2022 http://www.MarketOracle.co.uk - The Market Oracle is a FREE Daily Financial Markets Analysis & Forecasting online publication.