Most Popular
1. It’s a New Macro, the Gold Market Knows It, But Dead Men Walking Do Not (yet)- Gary_Tanashian
2.Stock Market Presidential Election Cycle Seasonal Trend Analysis - Nadeem_Walayat
3. Bitcoin S&P Pattern - Nadeem_Walayat
4.Nvidia Blow Off Top - Flying High like the Phoenix too Close to the Sun - Nadeem_Walayat
4.U.S. financial market’s “Weimar phase” impact to your fiat and digital assets - Raymond_Matison
5. How to Profit from the Global Warming ClImate Change Mega Death Trend - Part1 - Nadeem_Walayat
7.Bitcoin Gravy Train Trend Forecast 2024 - - Nadeem_Walayat
8.The Bond Trade and Interest Rates - Nadeem_Walayat
9.It’s Easy to Scream Stocks Bubble! - Stephen_McBride
10.Fed’s Next Intertest Rate Move might not align with popular consensus - Richard_Mills
Last 7 days
US House Prices Trend Forecast 2024 to 2026 - 11th Oct 24
US Housing Market Analysis - Immigration Drives House Prices Higher - 30th Sep 24
Stock Market October Correction - 30th Sep 24
The Folly of Tariffs and Trade Wars - 30th Sep 24
Gold: 5 principles to help you stay ahead of price turns - 30th Sep 24
The Everything Rally will Spark multi year Bull Market - 30th Sep 24
US FIXED MORTGAGES LIMITING SUPPLY - 23rd Sep 24
US Housing Market Free Equity - 23rd Sep 24
US Rate Cut FOMO In Stock Market Correction Window - 22nd Sep 24
US State Demographics - 22nd Sep 24
Gold and Silver Shine as the Fed Cuts Rates: What’s Next? - 22nd Sep 24
Stock Market Sentiment Speaks:Nothing Can Topple This Market - 22nd Sep 24
US Population Growth Rate - 17th Sep 24
Are Stocks Overheating? - 17th Sep 24
Sentiment Speaks: Silver Is At A Major Turning Point - 17th Sep 24
If The Stock Market Turn Quickly, How Bad Can Things Get? - 17th Sep 24
IMMIGRATION DRIVES HOUSE PRICES HIGHER - 12th Sep 24
Global Debt Bubble - 12th Sep 24
Gold’s Outlook CPI Data - 12th Sep 24
RECESSION When Yield Curve Uninverts - 8th Sep 24
Sentiment Speaks: Silver Is Set Up To Shine - 8th Sep 24
Precious Metals Shine in August: Gold and Silver Surge Ahead - 8th Sep 24
Gold’s Demand Comeback - 8th Sep 24
Gold’s Quick Reversal and Copper’s Major Indications - 8th Sep 24
GLOBAL WARMING Housing Market Consequences Right Now - 6th Sep 24
Crude Oil’s Sign for Gold Investors - 6th Sep 24
Stocks Face Uncertainty Following Sell-Off- 6th Sep 24
GOLD WILL CONTINUE TO OUTPERFORM MINING SHARES - 6th Sep 24
AI Stocks Portfolio and Bitcoin September 2024 - 3rd Sep 24
2024 = 1984 - AI Equals Loss of Agency - 30th Aug 24
UBI - Universal Billionaire Income - 30th Aug 24
US COUNTING DOWN TO CRISIS, CATASTROPHE AND COLLAPSE - 30th Aug 24
GBP/USD Uptrend: What’s Next for the Pair? - 30th Aug 24
The Post-2020 History of the 10-2 US Treasury Yield Curve - 30th Aug 24
Stocks Likely to Extend Consolidation: Topping Pattern Forming? - 30th Aug 24
Why Stock-Market Success Is Usually Only Temporary - 30th Aug 24
The Consequences of AI - 24th Aug 24
Can Greedy Politicians Really Stop Price Inflation With a "Price Gouging" Ban? - 24th Aug 24
Why Alien Intelligence Cannot Predict the Future - 23rd Aug 24
Stock Market Surefire Way to Go Broke - 23rd Aug 24
RIP Google Search - 23rd Aug 24
What happened to the Fed’s Gold? - 23rd Aug 24
US Dollar Reserves Have Dropped By 14 Percent Since 2002 - 23rd Aug 24
Will Electric Vehicles Be the Killer App for Silver? - 23rd Aug 24
EUR/USD Update: Strong Uptrend and Key Levels to Watch - 23rd Aug 24
Gold Mid-Tier Mining Stocks Fundamentals - 23rd Aug 24
My GCSE Exam Results Day Shock! 2024 - 23rd Aug 24

Market Oracle FREE Newsletter

How to Protect your Wealth by Investing in AI Tech Stocks

Gold Top? Long-term Chart Analysis

Commodities / Gold and Silver 2011 Jun 19, 2011 - 08:01 AM GMT

By: Willem_Weytjens

Commodities

Today I had a look at one of the charts I created a long long time ago (in late 2008). I was amazed by the accuracy of the lines I drew back then.

I drew Fibonacci levels from the bottom in 1976 (100$)=0.00% and assumed the highest close of 1980 (834$) would be the 50% Retracement level.


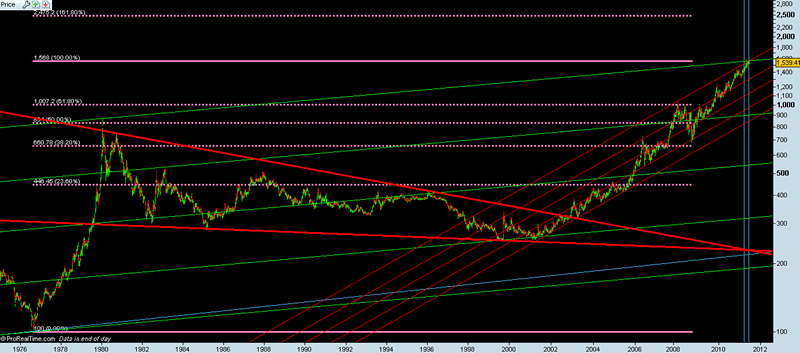
That means that there was a difference of 734$ between the 0.00% and 50.00% level, and that the 100% level would be the 50% level plus 734$, which equals 834$+734$=1568$. Please notice that the highest close ever was at 1563$ according to prorealtime software. So based on fibonacci levels, we might have reached THE top in gold for many years to come.

Now let’s have a look at the red triangle I drew over the tops from 1980 until 2002 and underneath the bottoms of 1982, 1985 and 1999.

When price broke out of this triangle in late 2002, it first retested this line in march 2003, and then never looked back.

The time target would be where the two lines eventually come together…which is roughly may 2011. I pointed this out with the two vertical blue lines.

So we now have the fibonacci levels telling us that $1568 could be a top, and that combined with an excellent timing, gives us even more reason to believe so.

I then drew parallel green trendlines underneath different support levels. What did they say? They colluded with the 100% Fibonacci retracment level AND with the time target of may 2o11.

I then drew parallel red trend lines underneath the bottoms from 2002 until 2006 and over the top of 2008. Yet again, they pointed at may 2011 with a price of $1568…

So yes, I think we have a good chance that gold is in the process of setting a top. The fact that miners are down so much while gold is only 2% below its all time high might be a sign that money was already flowing out of speculative positions such as mining stocks, while the price of gold is being kept high…

Please also notice that IF price would break out above this level, there is no resistance until 2475,2$, which would be the 161.80% retracement level. That is about 60% higher than current prices.

In short, we have very interested times ahead.

For more analyses and trading updates, please visit www.profitimes.com

Willem Weytjens

www.profitimes.com

© 2011 Copyright Willem Weytjens - All Rights Reserved

Disclaimer: The above is a matter of opinion provided for general information purposes only and is not intended as investment advice. Information and analysis above are derived from sources and utilising methods believed to be reliable, but we cannot accept responsibility for any losses you may incur as a result of this analysis. Individuals should consult with their personal financial advisors.


© 2005-2022 http://www.MarketOracle.co.uk - The Market Oracle is a FREE Daily Financial Markets Analysis & Forecasting online publication.


Post Comment

Only logged in users are allowed to post comments. Register/ Log in