


U.S. Real GDP in the Economic Current Recovery, How Does it Compare?
Economics / Economic Recovery Jul 23, 2011 - 05:52 AM GMTBy: Asha_Bangalore

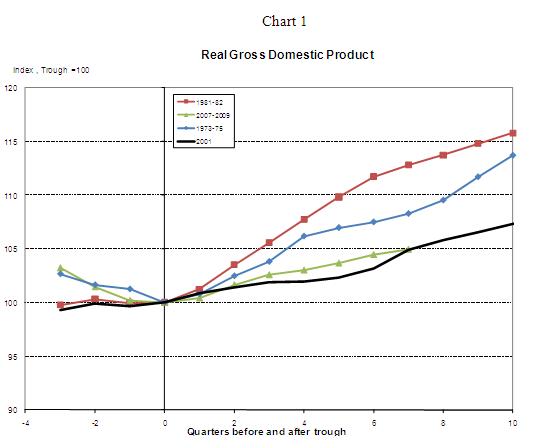
The current economic recovery is eight quarters old. The first estimate of real GDP growth for the second quarter will be published on July 29. Chart 1 is an index chart where real GDP data are set equal to 100 at the trough of each recession and real GDP for subsequent quarters are computed accordingly to enable comparisons of real GDP growth across recoveries. For example, a reading of 104 would mean that real GDP increased 4.0% from the trough. In 2011:Q1, the seventh quarter of economic recovery, real GDP rose 4.95% from the trough of the current recovery. At a similar stage of economic recovery after the 2001 recession, real GDP recorded a 4.88% gain.
The performance of the economy after the 1973-75 and 1981-82 recessions was superior by far (see Chart 1). The forecast range for real GDP growth in 2011:Q2, as per the Blue Chip survey in early-July, is 2.1%-4.1%. The chart points out that the pace of economic activity in the current business expansion has outpaced the performance of the economy after the 2001 recession in the early stages but has since slowed. The second quarter readings of GDP will offer further insights about the relative position of the current recovery after two years of economic growth.
Asha Bangalore — Senior Vice President and Economist
http://www.northerntrust.com
Asha Bangalore is Vice President and Economist at The Northern Trust Company, Chicago. Prior to joining the bank in 1994, she was Consultant to savings and loan institutions and commercial banks at Financial & Economic Strategies Corporation, Chicago.
Copyright © 2011 Asha Bangalore
The opinions expressed herein are those of the author and do not necessarily represent the views of The Northern Trust Company. The Northern Trust Company does not warrant the accuracy or completeness of information contained herein, such information is subject to change and is not intended to influence your investment decisions.
© 2005-2022 http://www.MarketOracle.co.uk - The Market Oracle is a FREE Daily Financial Markets Analysis & Forecasting online publication.