


Stock Markets Fall on Trouble in Monetary Paradise
Stock-Markets / Stock Markets 2011 Jul 31, 2011 - 04:19 AM GMTBy: Tony_Caldaro

 Equities declined throughout the week right from the gap down open on monday into the close on friday. In the end US equities experienced the worse weekly loss since the Primary wave II bottom in July 2010. The monthly economic reports were mostly negative, outpacing positive reports by 2:1. On the positive side: Case-Shiller, consumer confidence, and the WLEI all improved, while weekly jobless claims dropped.
On the negative: new/pending home sales declined, along with, durable goods orders, the Chicago PMI, consumer sentiment, the monetary base, PCE prices and Q2 GDP was lower than expected. The SPX/DOW lost 4.05%, and the NDX/NAZ lost 3.20% even though the NDX made a new bull market high on tuesday. Asian markets were -2.4%, European markets were -3.3%, the Commodity equity group was -2.3%, and the DJ World index lost 2.9%. Next week we have the ISM reports, Auto sales and the monthly Payrolls report.
LONG TERM: bull market remains at inflection point
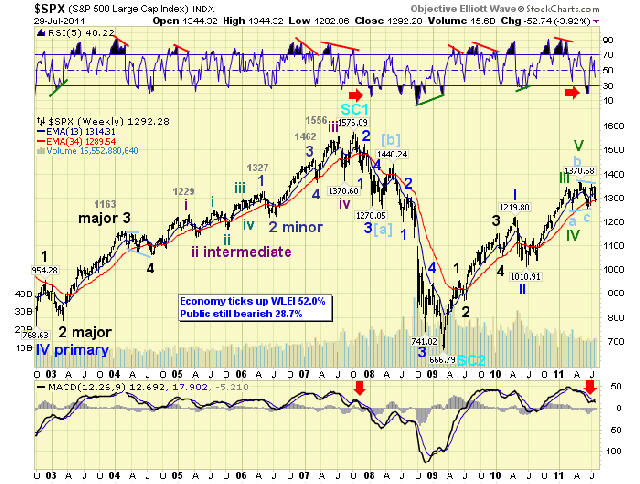
For the past several months we have been reporting this market was deviating from our projected expectations. The July 2010 uptrend lasted a month longer than expected and ended above 1313 pivot, and uncharacteriscally in between two pivots. The February 2011 correction that followed ended above expectations, but it led to a shorter than expected and weak March 2011 uptrend. Then in June the market become quite oversold, for a bull market, on the weekly RSI. Nevertheless we stayed the course of a subdividing Primary III. We posted a couple of bearish SPX alternate counts on the NDX/NAZ charts. Then one on the DOW charts. During the month of July, however, the market stalled in its long term upward trend offering a variety of potential counts. We call this type of event an inflection point. Some are resolved to the upside, like 2005 and 2010. Others are resolved to the downside like in 2007. This one is leaning to the downside, but none of the five potential counts have been eliminated yet.
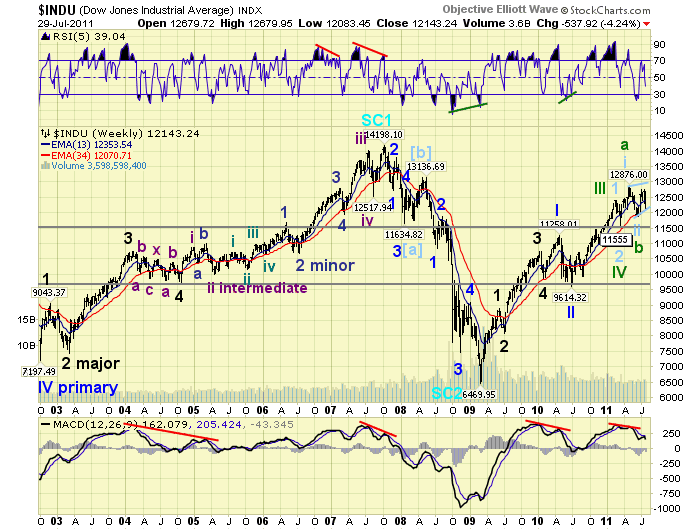
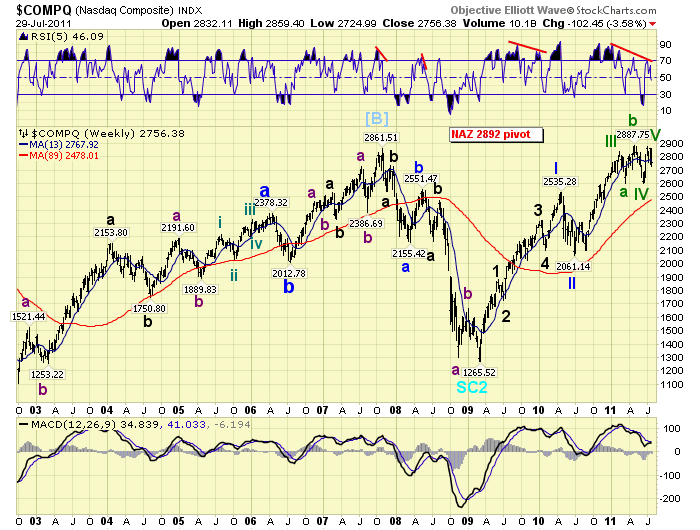
When we review the foreign markets, (which continue to be weak), the long term technical indicators, (six of the eight are displaying negative divergences), and the potential OEW chart patterns, (one has the bull market completed, two have it in the process of completing, and the other two suggest it will continue), we sense there are just too many negatives at this time for the bull market to continue much longer. If it has not already ended. We noted this week the SPX/DOW could have peaked in May and the NDX/NAZ recently in July. These counts are gaining in probability. We continue to employ a defensive investment strategy.
MEDIUM TERM: uptrend in jeopardy
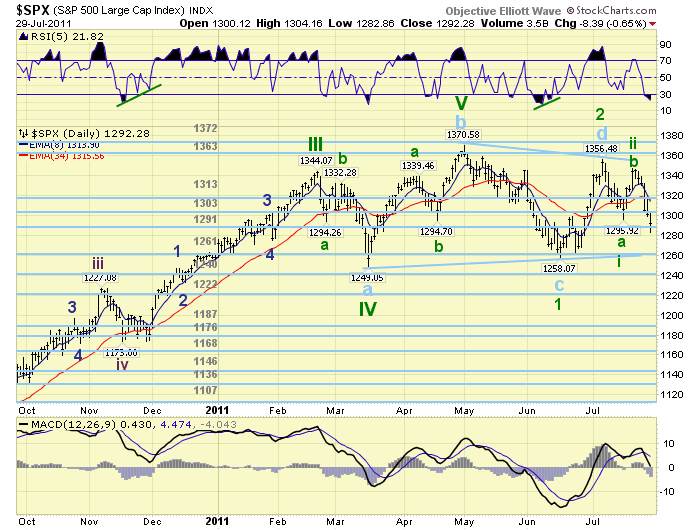
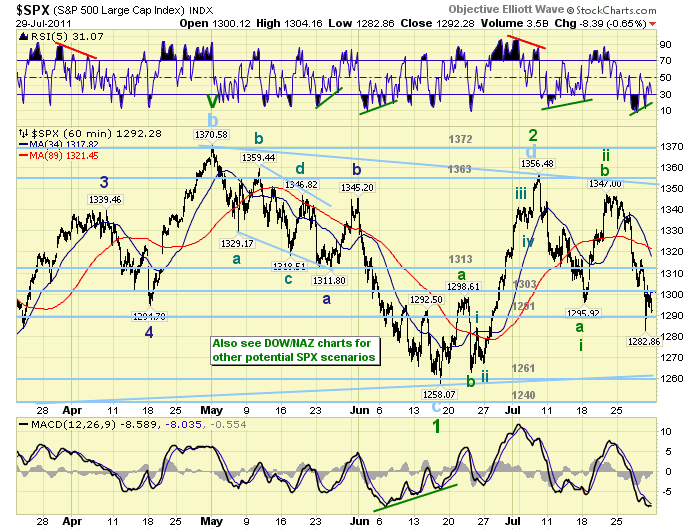
The uptrend from the SPX 1258 June low had barely travelled 100 points (1356), and is now already in danger of confirming a downtrend. Unless the market rallies strongly in the next few days a downtrend confirmation is all but assured. Should this occur some of the potential counts will begin to get eliminated. The market is at a point in time is determining its own future path. Currently the SPX/NAZ counts, charts above, hold the highest probability.
When we review the internal waves of the current uptrend in the four major indices. We see a clear five waves up in the NDX to new highs, a nearly clear five up in the DOW with no new high, and either a failed fifth or three wave advance in the SPX/NAZ. The recent selloff has already retraced most of the uptrend in the SPX/DOW. Should the OEW 1291 pivot fail to hold support a downtrend confirmation is next.
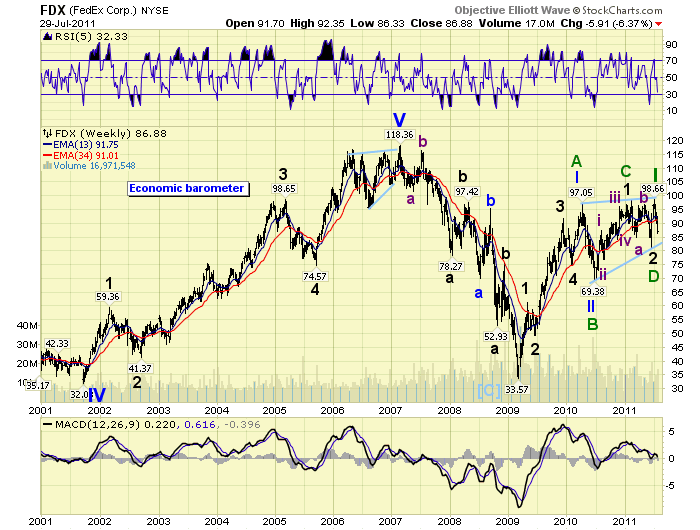
Currently, three of the nine SPX sectors are already in confirmed downtrends, the VIX is uptrending, six of the fifteen world indices are in confirmed downtrends, and four of the five Commodity sectors are in confirmed uptrends. This suggests equity markets around the world are weakening, volatility is increasing, and the commodity bull market is re-establishing itself. Investors may now be shifting from paper assets to something more tangible; like crude oil, basic metals, livestock and of course precious metals. What is also disconcerting is the potential longer term diagonal triangles in the economically sensitive FDX, and one of the tech leaders GOOG.
SHORT TERM
Support for the SPX is now at 1291 and then 1261, with resistance at 1303 and then 1313. Short term momentum created a positive divergence at friday’s SPX 1283 low and the market rallied to 1304. The best rally since this decline began on monday. Every day this past week was met with a lower low than the day before. And, overnight selling created gap down openings, breaking through support levels, on three of the five days. Until this pattern changes the market will remain under selling pressure. Short term support is at the 1291 pivot, the mid-1280′s and then the 1261 pivot range. Overhead resistance is at the 1303 and 1313 pivot ranges.
Should this market continue to decline, breaking through the OEW 1261 and 1240 pivots. Then three of the potential counts will be eliminated and we will be left with two bear market counts: SPX/DOW peak in May and a NDX/NAZ peak in July. Support, longer term, under a bear market scenario is around SPX 1000. Should the market hold the OEW 1261 pivot the bull market still has a change to reassert itself.
To sum it up, objectively. If the OEW 1291 pivot fails we’re in a medium term downtrend. If the OEW 1261 pivot fails the bull market is certainly in serious trouble. Then if the OEW 1240 pivot fails a bear market is probably underway. Best to your trading/investing.
FOREIGN MARKETS
Asian markets were mostly lower on the week losing 2.4%. Australia and Hong Kong remain in downtrends. China and Japan in bear markets.
European markets were all lower for a net loss of 3.3%. Spain, Switzerland and the Stox are in downtrends. Spain and Switzerland in bear markets.
The Commodity equity group were all lower for a net loss of 2.3%. Brazil is in a downtrend, and very likely a bear market.
The DJ World remains in a weakening uptrend losing 2.9% on the week.
COMMODITIES
Bonds rallied strongly on friday +1.1% on the week. Bond prices are uptrending and rates downtrending. The 10YR is now at 2.8%.
Crude is again uptrending, but lost 2.6% on the week. This has been a choppy market lately.
Gold made new all time highs again this week, gaining 2.0% and hitting $1638. Silver is uptrending but ended the week -0.5%.
The USD is downtrending again, losing 0.4% on the week, and also quite choppy. The EUR gained 0.3%, the JPY gained 2.2% to all time new highs along with the CHF.
NEXT WEEK
A busy economic week starts on monday with ISM manufacturing and Construction spending at 10:00. On tuesday Personal income/spending and monthly Auto sales. Wednesday we have the ADP index, Factory orders and ISM services. Then on thursday weekly Jobless claims. Friday we have the monthly Payrolls report and Consumer credit. The FED has nothing scheduled ahead of the FOMC meeting on Aug 9th. Unless, of course, the political circus in Wash, DC fails to extend the debt limit. Interesting week ahead. Best to you and yours!
CHARTS: http://stockcharts.com/...
http://caldaroew.spaces.live.com
After about 40 years of investing in the markets one learns that the markets are constantly changing, not only in price, but in what drives the markets. In the 1960s, the Nifty Fifty were the leaders of the stock market. In the 1970s, stock selection using Technical Analysis was important, as the market stayed with a trading range for the entire decade. In the 1980s, the market finally broke out of it doldrums, as the DOW broke through 1100 in 1982, and launched the greatest bull market on record.
Sharing is an important aspect of a life. Over 100 people have joined our group, from all walks of life, covering twenty three countries across the globe. It's been the most fun I have ever had in the market. Sharing uncommon knowledge, with investors. In hope of aiding them in finding their financial independence.
Copyright © 2011 Tony Caldaro - All Rights Reserved Disclaimer: The above is a matter of opinion provided for general information purposes only and is not intended as investment advice. Information and analysis above are derived from sources and utilising methods believed to be reliable, but we cannot accept responsibility for any losses you may incur as a result of this analysis. Individuals should consult with their personal financial advisors.
© 2005-2022 http://www.MarketOracle.co.uk - The Market Oracle is a FREE Daily Financial Markets Analysis & Forecasting online publication.