What Current Stock Market Decline Has in Common With March’s Correction
Stock-Markets / Stock Markets 2011 Aug 04, 2011 - 10:50 AM GMTBy: Mike_Paulenoff
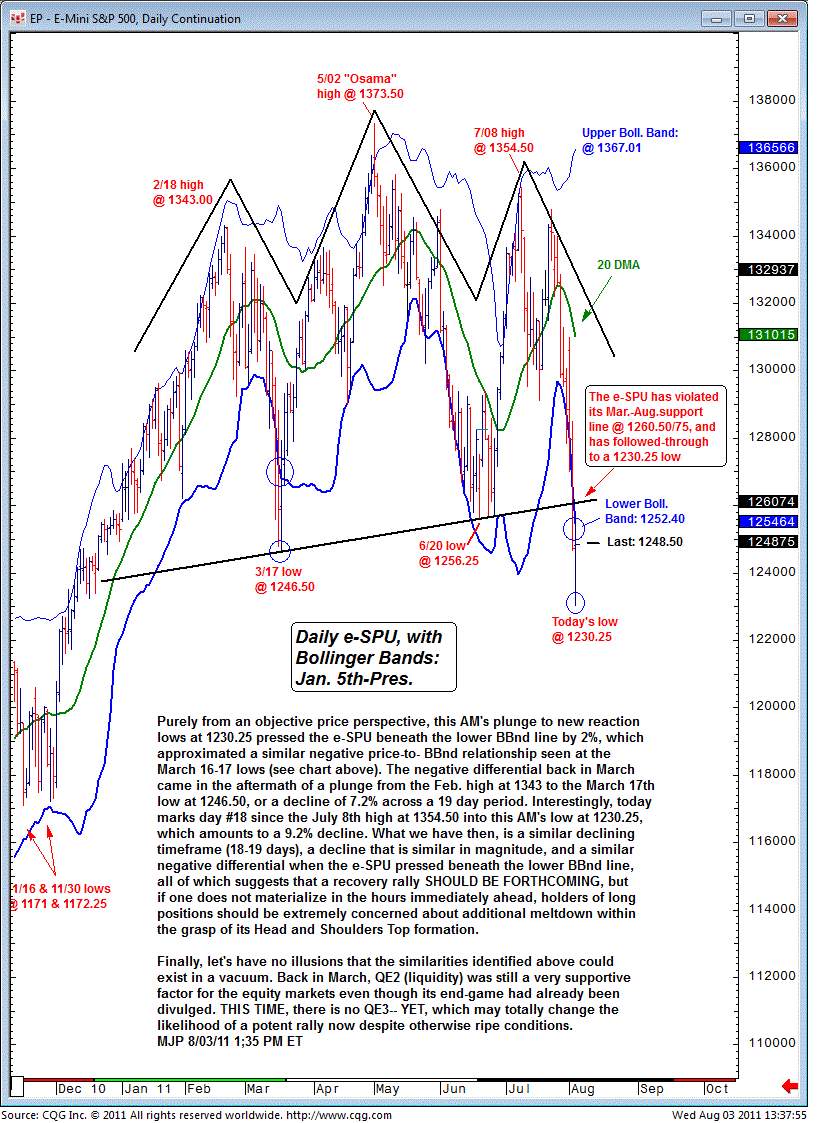
Purely from an objective price perspective, Wednesday morning's plunge in the S&P 500 to new reaction lows at 1230.25 in its emini contract pressed the index beneath the lower Bollinger Band (BBnd) line by 2%. This approximates a similar negative price-to-BBnd relationship seen at the March 16-17 lows.
The negative differential back in March came in the aftermath of a plunge from the February high at 1343 to the March 17 low at 1246.50, or a decline of 7.2% across a 19-day period. Interestingly, Wednesday marks the 18th day since the July 8 high at 1354.50, which amounts to a 9.2% decline into Wednesday morning’s low at 1230.25.
What we have, then, is a similar declining timeframe (18-19 days), a decline that is similar in magnitude, and a similar negative differential when the e-mini S&P pressed beneath the lower BBnd line. All of this suggests that a recovery rally should be forthcoming, but if one does not materialize in the hours immediately ahead, holders of long positions should be extremely concerned about additional meltdown within the grasp of its head and shoulders top formation.
Finally, let's have no illusions that the similarities identified above could exist in a vacuum. Back in March, QE2 (liquidity) was still a very supportive factor for the equity markets even though its end game had already been divulged. This time there is no QE3 -- not yet -- which may totally change the likelihood of a potent rally now despite otherwise ripe conditions.

Sign up for a free 15-day trial to Mike's ETF & Stock Trading Diary today.
By Mike Paulenoff
Mike Paulenoff is author of MPTrader.com (www.mptrader.com), a real-time diary of his technical analysis and trading alerts on ETFs covering metals, energy, equity indices, currencies, Treasuries, and specific industries and international regions.
© 2002-2011 MPTrader.com, an AdviceTrade publication. All rights reserved. Any publication, distribution, retransmission or reproduction of information or data contained on this Web site without written consent from MPTrader is prohibited. See our disclaimer.
Mike Paulenoff Archive |
© 2005-2022 http://www.MarketOracle.co.uk - The Market Oracle is a FREE Daily Financial Markets Analysis & Forecasting online publication.


