


Gold Indepth Analysis and Charts on Daily and Weekly Timeframes
Commodities / Gold and Silver 2011 Aug 29, 2011 - 12:51 PM GMTBy: Capital3X

 Gold touched intra day 1913 before correcting back to 1700. The level of the pullback and the speed with which it pulled back may have surprised many. But this was expected given the parabolic trend (Weekly charts) into which Gold has now entered.
We have superimposed powerful indicators on daily and weekly charts for Gold to understand price action in future. So often proved by us, that yesterday price action can predict tomorrow price action with a high degree of certainty!
We have worked at firms like PIMCO where this has been done on a regular basis which is why hedge funds make money. Now for the first time, we are bringing these tools onto the retail space.
Gold Daily charts: A pause ?
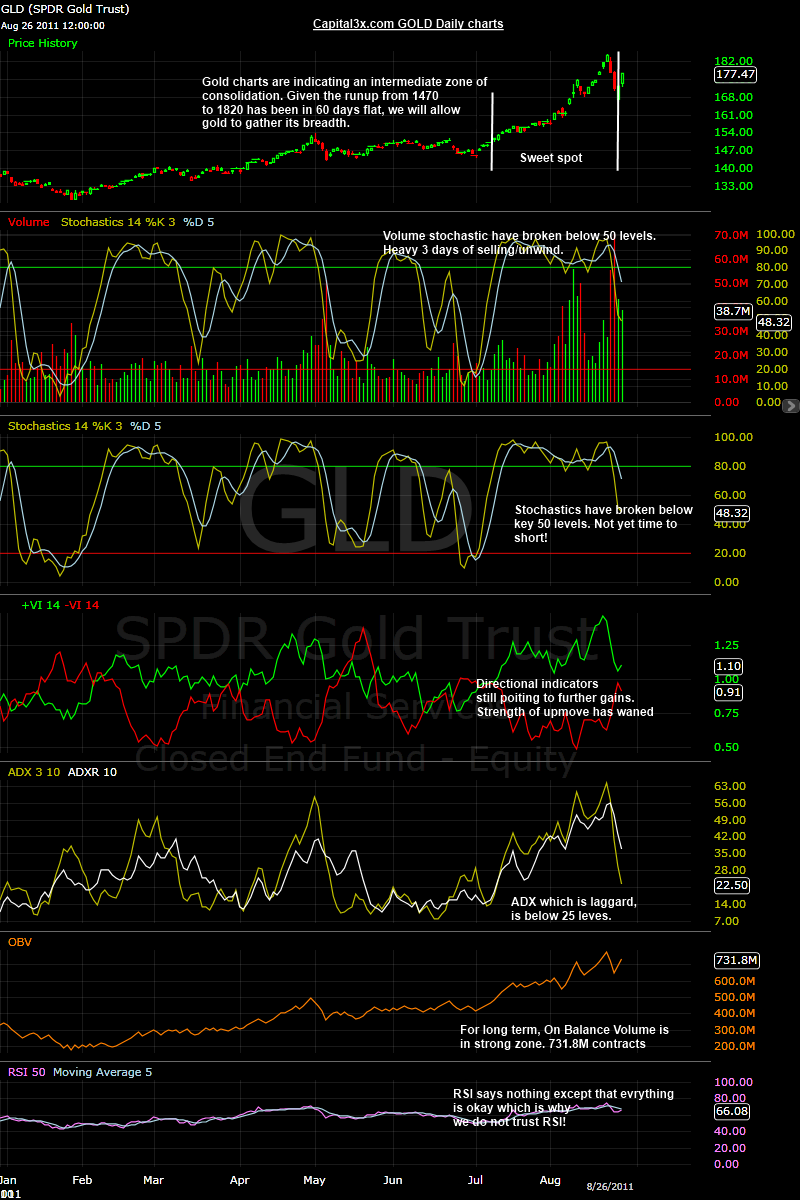
The daily charts are suggesting a break in strength. While the trend was just nearly maintained last week but just about.
- Price Stochastic are at 48 levels while volumes stochastic are also below 50. The daily trend strength has now weakened. We look forward to a zone of strong consolidation with prices to fluctuate below 1850-1875. The downtrend can extend upto 1600 on a conservative basis and 1400 on an aggressive basis.
- Directional Indicators(Vortex Indicators) are showing a pause in the trend.The +VI has now almost converged to -VI at 0.91. The +VI is for the record above the -VI. But these things can change in one hour of trading and hence we do not read too much into the levels when they are that close.
- ADX is at a pathetic 22 levels. ADX is indicating that Gold is going into period of consolidation with lots of sideways movement. The new step level is between 1600 and 1850.
We are extremely bullish Gold but as a smart trader one needs to put the money where the big moves are happening. Gold will be a intra day traders delight and we will be putting Gold trade for our day traders. But for the long term term trader with wide margins, we look at the weekly charts below.
Gold Weekly charts: Hyper Bullish ?
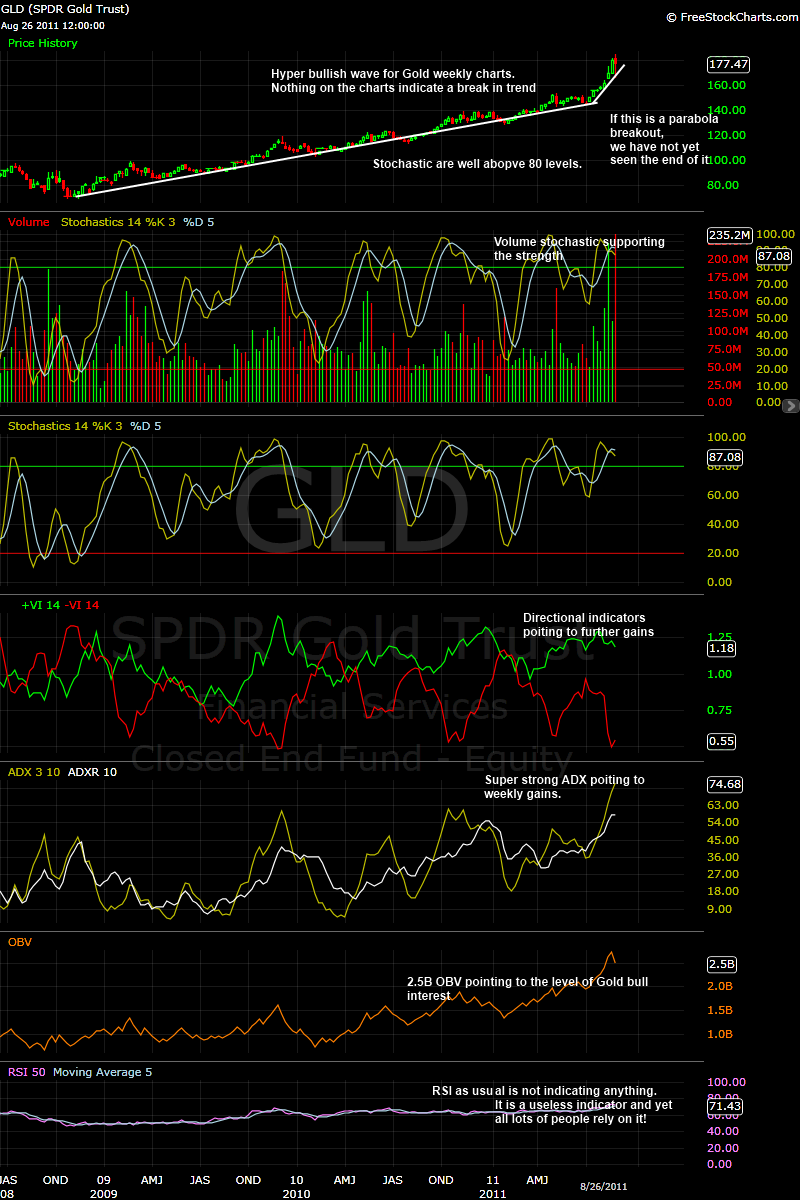
The weekly charts are suggesting further upside. If this is a parabolic breakout, which we do believe it is, there is far more upside left in this move.
- Price Stochastic are at 87 levels while volumes stochastic are also well above 50. The weekly strength in Gold continues to be strong.
- Directional Indicators(Vortex Indicators) are showing further gains with the +VI diverging away from -VI on the upside, vetting the upmove.
- ADX is at 74 levels. Any level above 40 is bullish. But we also understand that ADX indicators are lagging indicator and only flashes its signals once a move is well underway. We love to catch a move right in the first 5% of its move.
- Weekly RSI are at 71 but we have never paid attention to RSI as they lag the price movement. There is no point looking back at a move and saying we could have done this based on RSI.
Our analysis on price action on the weekly charts indicate renewed bullish strength for Gold. Nothing has changed for Gold over the last 10 days even though it has come off by 10%. But the short term traders playing on small margins with limited capital must be careful trading the weekly charts for Gold. Gold on a intra week basis can swing as much as 20% and wipe off most traders. Therefore, short term traders beware of Gold charts on weekly basis. Short term traders must concentrate on daily charts which call for caution.
Our feeds: RSS feed
Our Twitter: Follow Us
Kate
Capital3x.com
Kate, trading experience with PIMCO, now manage capital3x.com. Check performance before you subscribe.
© 2011 Copyright Capital3X - All Rights Reserved
Disclaimer: The above is a matter of opinion provided for general information purposes only and is not intended as investment advice. Information and analysis above are derived from sources and utilising methods believed to be reliable, but we cannot accept responsibility for any losses you may incur as a result of this analysis. Individuals should consult with their personal financial advisors.
© 2005-2022 http://www.MarketOracle.co.uk - The Market Oracle is a FREE Daily Financial Markets Analysis & Forecasting online publication.