


Markets Signaling Economic Recession
Stock-Markets / Financial Markets 2011 Sep 30, 2011 - 10:45 AM GMTBy: EconMatters

 We at EconMatters expected the QE2 froth to come out of markets once the fed experiment of artificially inflating asset prices was over, and for the most part this is exactly where we are today at the crossroads.
Are we going to just trudge along with a slow growth economy until the world finally works its way out of the housing inventory overhang, and the next building phase takes hold and there is a strong surge in the labor markets from the bottom up, or are we going to take the next leg down and head back into a recessionary environment?
Remember, the official definition for a recession is two consecutive quarters of negative GDP growth, and is determined after the fact. However, there are some market signs which in real time can give us a clue as to which course the economy seems to be taking.
Crude Oil
The First is the price of Oil which is a barometer for economic growth and future expectations for demand. I know that is the analyst approach for the benchmark, the more cynical side of me believes the price of Oil trades more in line with the S&P 500, and is really more of an asset class investment vehicle than any true economic indicator of strong future demand for the commodity.
But in either case if WTI falls below $70 and stays there than I would say this is a pretty good sign that the US is likely experiencing at least one quarter of negative GDP growth, and pretty near recessionary levels. In regards to Brent, there is approximately a $22 premium over WTI right now, and any significant tightening of this spread would also be something to pay attention to for recessionary concerns.
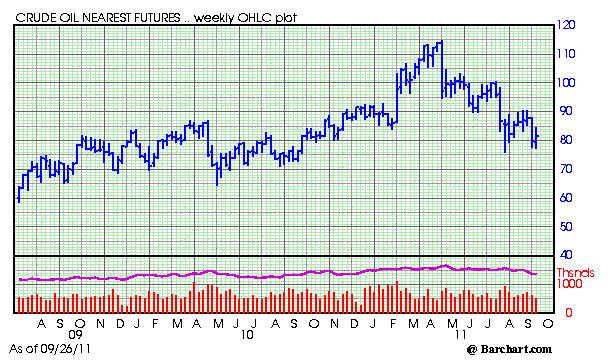
The reason for this is that if China is still growing at 9% they can use lower Oil prices to stockpile supplies and provide some kind of floor in the Oil market, but if the Brent contract price becomes weak this tells a lot about what economic conditions are like in the emerging economies.
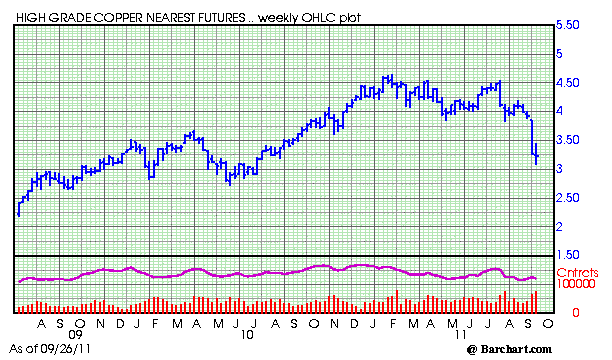
Copper
The Second asset class to be cognizant of is the Copper market. Copper is often referred to as having a PhD in economics for its insight into industrial demand for the manufacturing, construction, and supply chain sectors of the economy.
It has lost some of that appeal as an economic indicator with its recent (last couple of years) status as a currency hedge being pulled up by Silver and Gold in particular on currency devaluation concerns.
But still if Copper trades below $2.50 a pound and stays there then we are probably in a full blown recession, and fiscal and monetary policy responses will be direly needed to counteract this deflationary spiral.
Congress would have to get serious about stimulating the economy by providing some reallocation of resources which create little to no additive jobs to large scale infrastructure projects which create many more jobs all along the supply chain and also incorporate heavy handed tax incentive policies for small and medium sized businesses which are struggling now due to reduced loan capacity from the lending institutions.
Congress probably needs to incentivize banks to lend maybe even at the expense of some bad loans along the way if we are at this stage in the economy because this stage feeds on itself and perpetuates the deflationary cycle further.
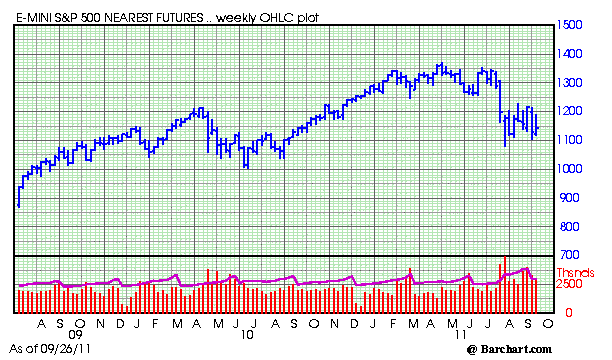
S&P 500
The Third asset class is the S&P 500, if it falls below 950 and stays there then for all intents and purposes we are in a recession, officially designated or not. The S&P 500 was last in this territory July of 2009, and has really not looked back since. A bearish revisit to the 950 area spells recession for the following reasons.
This means risk capital has left the building so to speak, and is tucked away in capital preservation mode. It also means the “Wealth Effect” in reverse, people don`t feel much like spending (especially on discretionary consuming) when they feel poor, and are in the hunkered down saving mode.
These effects extend all the way through the economy from the retail sector which needs fewer employees, to the entertainment and dining sector of the economy as well. All this means less jobs, and higher unemployment.
Another troubling sign for the economy is that CEOs watch stock prices diligently, maybe a little too much, but they do. And a weak stock price for large companies means a conservative nature towards financing aggressive projects, and even worse full blown cost cutting mode. All of which means less jobs, and a continued perpetuation of the deflationary cycle in the economy.
Another disconcerting aspect of a 950 S&P level would be that an already beleaguered banking and financial services sector would probably be reducing jobs at a significantly higher rate, and this sector weakness permeating through the economic has the definition of recession written all over it.
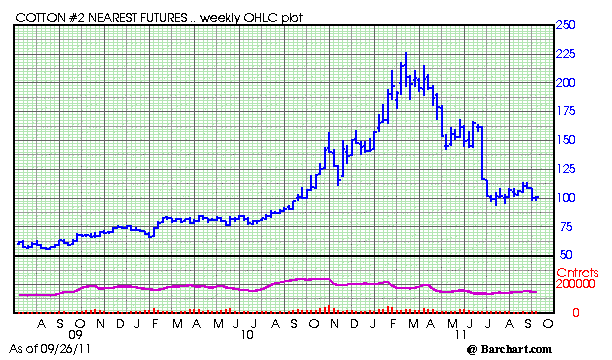
Cotton
The Fourth asset class is Cotton which had quite a run this past year going from around $80 around July of 2010 to a high of $227 in March of 2011. Most analysts at the time bought into all the supply shortage rhetoric that permeates Wall Street in the midst of a bullish QE2 asset inflating all you can eat bonanza buffet trade.
However, being skeptical by nature and observing that Cotton behaved similarly to many other commodities like Oil, RBOB, Silver, Copper, and Equities prior to and directly after Bernanke`s Jackson Hole Speech where he signaled QE2 all the way to the ending of QE2 and its effects.
It appears that the run up in Cotton was for the most part fueled by artificial means and not true demand, or supply shortage issues. By artificial means I refer to as hot capital inflows into the commodity fund space, with the added artificiality of $600 Billion of new liquidity sloshing around the financial markets looking for a home like a bull in a china shop.
Cotton is currently trading around $100, and breaking through the $60 level would be quite bearish and reflective of a recessionary trend for the commodity as clothes when you really get right down to it are highly discretionary.
When global consumers pull back because of several quarters of above average inflation and stagnant wages, this equates to lower purchasing power and eventually prices must come back down as the entire supply chain adjusts to a lower consumption model.
So if we should witness $60 Cotton, this is a sign that consumers have pulled back, and is now being reflected back through the supply channels to the base commodity Cotton, and is another deflationary recessionary market signal.
A Real Inflection Point
My thought was that asset prices were correcting naturally after QE2, summers usually experience a slowdown in the economic data and activity, and that the overall economy would need to recover from above average commodity prices for a couple of months.
But that come mid October through the Christmas Holiday season where many businesses make their numbers, and economic activity and data start grinding higher that this just represents an excellent buying opportunity (maybe one more little leg down).
Furthermore, that asset prices and economic activity remain bullish through the strong investment and business activity months of January through May, with the added benefits of 2012 being an election year, that markets could go on a nice run from mid-October to the end of May before any signs of summer selling occurs, and investors might want to take some profits.
And who knows with it being an election year, we might run straight through until the end of 2012 ( a lot of this depends on Congress working together, markets approving of election results, etc.) So this appeared to be a great time to start accumulating positions.
But Markets have been selling hard into any rallies, there is a lot of investor and business uncertainty out there in the market, and there are more signs that we have the potential to move in the other direction, towards another recession, the dreaded double dip, then there were just a month ago.
In short, the economy seems to be at a crucial point, and a credible argument can be made for going in either direction from here, and this is illustrated in the cautious approach by investors.
So these are some of the market signs that may give investors and market watchers a heads-up that the economy is heading in the wrong direction long before the economic data and GDP reports confirm that we are indeed in a recession.
By EconMatters
The theory of quantum mechanics and Einstein’s theory of relativity (E=mc2) have taught us that matter (yin) and energy (yang) are inter-related and interdependent. This interconnectness of all things is the essense of the concept “yin-yang”, and Einstein’s fundamental equation: matter equals energy. The same theories may be applied to equities and commodity markets.
All things within the markets and macro-economy undergo constant change and transformation, and everything is interconnected. That’s why here at Economic Forecasts & Opinions, we focus on identifying the fundamental theories of cause and effect in the markets to help you achieve a great continuum of portfolio yin-yang equilibrium.
That's why, with a team of analysts, we at EconMatters focus on identifying the fundamental theories of cause and effect in the financial markets that matters to your portfolio.© 2011 Copyright EconMatters - All Rights Reserved Disclaimer: The above is a matter of opinion provided for general information purposes only and is not intended as investment advice. Information and analysis above are derived from sources and utilising methods believed to be reliable, but we cannot accept responsibility for any losses you may incur as a result of this analysis. Individuals should consult with their personal financial advisors.
© 2005-2022 http://www.MarketOracle.co.uk - The Market Oracle is a FREE Daily Financial Markets Analysis & Forecasting online publication.