


Is the Stock Market About to Stage A Multi-Month Rally?
Stock-Markets / Stock Markets 2011 Oct 08, 2011 - 05:48 AM GMTBy: J_W_Jones

 The S&P 500 must have taken notice of the multitude of headlines coming at market participants and proceeded on a path of pure chaos. Since October 4th, the S&P 500 Index (SPX) managed to trade in a range that spanned from 1,074 to as high as 1,171 in 4 days. To put the past 4 days price action into perspective, the S&P 500 Index rallied 97 points or 9% in less than 96 hours.
Since late July, market participants have been dealing with a whipsaw that has been wrought with headline risk coming from Europe and huge swings in the price action of the volatility index. A few short days ago I was calling for a bounce higher in the SPX as every time frame was oversold. After the jobs number came out Friday morning domestic equities rallied sharply higher and in the short-term prices were excessively overbought prompting some profit taking.
Around lunch time the news wires broke that Spain and Italy had their sovereign debt downgraded by Fitch Ratings. The downgrade put U.S. banks under pressure quickly and the price action started to rollover. By the end of the day price action was starting to work higher but a sharp selloff played out in the final 30 minutes of the session putting the major indices back into the red at the closing bell. So the real question that lies ahead is where do we go from here?
There is no easy answer to that question as the headline risk coming out of Europe over the weekend could have a dramatic impact on prices on Monday. Just as a reminder, U.S. bond markets will be closed on Monday for Columbus Day, but equities markets will be open as usual. At this point in time my short term bias is to the downside.
It would be healthy to see the S&P 500 roll over here and find a key support level where buyers step in and support prices. A higher low would be constructive and could lead to a more prolonged intermediate term rally which could last into the holiday season. However, before we can see any sort of rally we need to see a bottom form. While I do believe we have initiated that process, until I see a higher low carved out on the daily chart I will consider the current price structure to remain bearish.
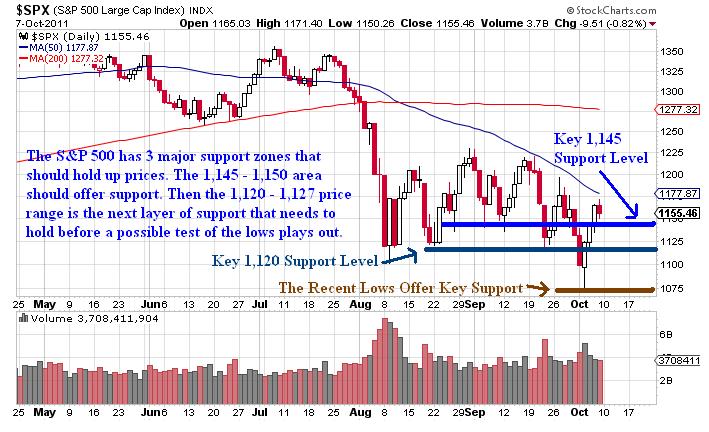
In order to break to new lows, the SPX would have to push through several layers of support. I am of the opinion that we are unlikely to see the recent lows broken, but the chart below illustrates the key support levels going forward. A test of the 1,040 – 1,050 price range remains possible, but the price action the past week makes it seem less likely. Within the context of a hyper volatile period of time, just about any possible outcome remains feasible. The daily chart of the SPX below illustrates key support levels for the index:
In addition to the weak price action into the close on Friday, several other clues are pointing to potentially lower prices in the near future. Members of my service know that I focus daily on several underlying ETF’s which help me get a grasp of the overall market conditions. On Friday, the financials (XLF), the Dow Jones Transportation Index (IYT), and the Russell 2000 Index (IWM) all showed relative weakness against the S&P 500. The chart below illustrates the relative performance on Friday:
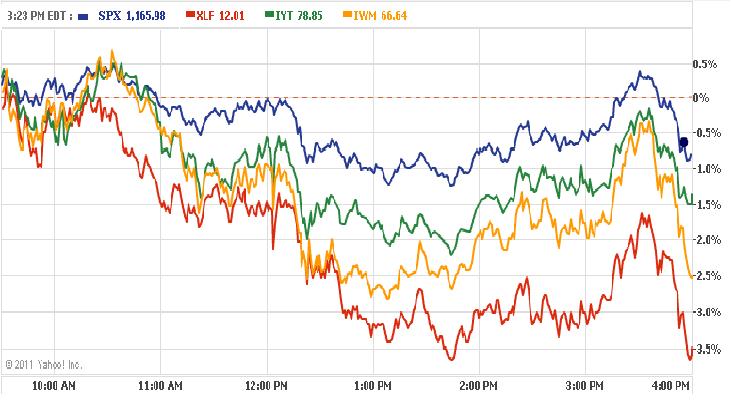
The financials and the Dow Jones Transportation Index are excellent sectors to monitor when trying to determine the future price action of the S&P 500. Most of the trading session on Friday the financials (XLF) were exhibiting relative weakness versus the S&P 500 Index. Later in the session, the Dow Jones Transportation Index (IYT) started to roll over as well and once both ETF’s were under pressure it was not long before the S&P 500 Index flipped the switch to the downside.
The financials (XLF), the Russell 2000 (IWM), and the Dow Jones Transports (IYT) all put in large reversal candlesticks on the daily chart by the close of business on Friday. This is an ominous signal that lower prices for domestic equities may be forthcoming. The fact that key sectors are showing signs of weakness is a negative omen for the S&P 500 and the early part of next week. However, there is a bright side to this scenario.
If support levels can hold up prices next week and we see a higher low on the daily chart form, the bottoming process could be underway which could lead to a strong rally into year end. Obviously a probe to new lows is possible, but I believe that we are in the beginning stages of forming a bottom and a base for a rally to take shape.
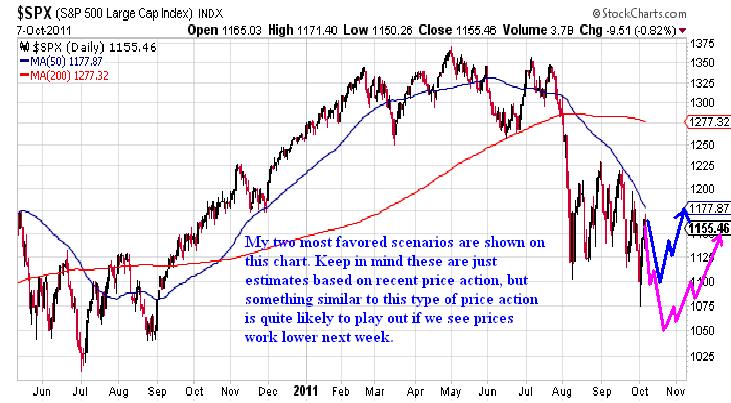
If support levels hold up prices, a bottoming formation will likely get carved out on the daily chart of the SPX. The chart below illustrates two potential outcomes that could cause prices to rally sharply. In one case, a higher low is formed and we see prices take off to the upside. The other scenario involves an intraday selloff down to the 1,040 – 1,050 price level that gets snapped back up and a huge reversal candlestick would be formed. These scenarios are common during bottoming processes. The daily chart of the S&P 500 Index is shown below with the two scenarios highlighted:
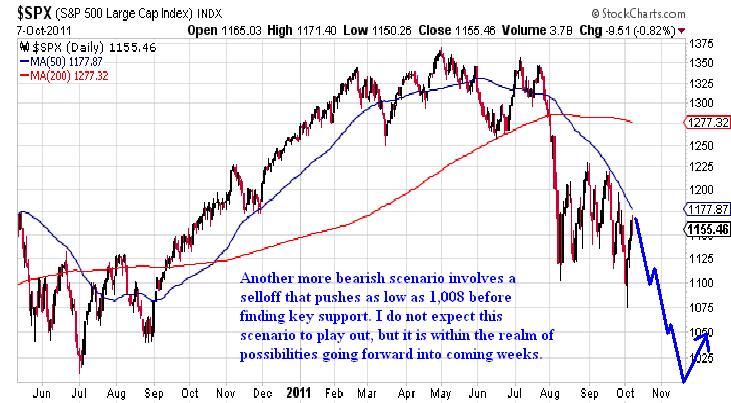
The other scenarios would involve prices blowing through support and possibly knifing down to test the S&P 500 1,000 – 1,008 support area. While I find this scenario to be less likely at this time, anything could happen in this trading environment.
The key in the short run is the utilization of defined risk through the use of stop orders. In addition, a trading plan with stop orders and profit taking levels planned ahead will help remove emotion in a volatile tape. The price action is wild, but from my perch the likely scenarios all involve some short term selling pressure. If my analysis is right, this could be a huge turning point for price action the rest of the year.
The next few weeks are going to provide us with clues about the rest of 2011. The question traders should really be asking is whether support will hold, or will we break below the recent lows? Right now, the upside looks limited, but in this trading environment the best thought out plans can turn out to be useless if price action does not cooperate. Be nimble and define your risk, as volatility is not likely to subside anytime soon.
Review my track record and join now at http://www.optionstradingsignals.com/specials/index.php and receive a 66% off coupon which expires tomorrow.
J.W. Jones is an independent options trader using multiple forms of analysis to guide his option trading strategies. Jones has an extensive background in portfolio analysis and analytics as well as risk analysis. J.W. strives to reach traders that are missing opportunities trading options and commits to writing content which is not only educational, but entertaining as well. Regular readers will develop the knowledge and skills to trade options competently over time. Jones focuses on writing spreads in situations where risk is clearly defined and high potential returns can be realized.
This article is intended solely for information purposes. The opinions are those of the author only. Please conduct further research and consult your financial advisor before making any investment/trading decision. No responsibility can be accepted for losses that may result as a consequence of trading on the basis of this analysis.
© 2005-2022 http://www.MarketOracle.co.uk - The Market Oracle is a FREE Daily Financial Markets Analysis & Forecasting online publication.