


Stock Market Bears Fight Back on the Back of US Dollar
Stock-Markets / Stock Markets 2011 Nov 07, 2011 - 03:28 AM GMT

 In last week's article you may recall that I suspected the rally from the Oct 4th lows was going to a 3 wave move, which would create a problem for the bulls and that whilst it was a strong move, being 3 waves, it still confirmed that the bounce was part of something that likely over the coming weeks should surrender itself to lower prices.
If you further recall I mentioned about the DX 76 area and the bulls needed to respect any move that saw price move back above that area.
Well such a move came early on the Monday. The US$ was already on fire from the Asian session if I recall it was above the 76 area as London opened on Monday morning, the clues were already there for those that were listening, the very fact you had a impulsive strong looking move on the DX, was a big warning sign for the bulls to step away and not be buying the market, as clearly the market had made a stance again by putting itself back above the 76 then 76.50 area.
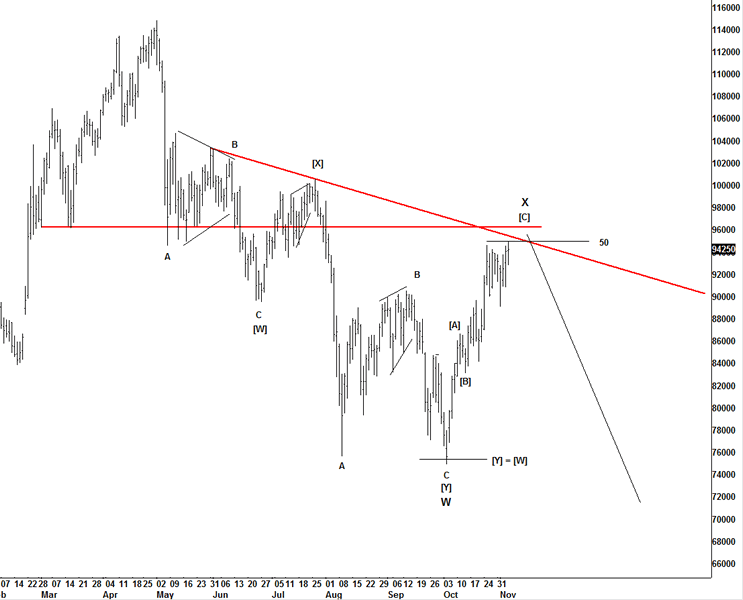
It seems the bulls nor the bears can make any head wind on this range, hence you see the swings we are seeing virtually every week. However the trend imo is still down on the DX, whilst it has the potential to see back above the Oct 4th highs, the overall lack of any real strong wave structure lends itself to one of 2 potential ideas going forward.
The range is the issue here for both bulls and bears, and until we actually make a solid trend away from this area, I think going forward there is a going to be a war between the bulls and bears.
I personally I am not as bullish as some technicians on the US$, although I am big believer of where the US$ goes so does risk markets.
In order to see the crashes and heavy price declines many are expecting, you are going to need to see a big move in the US$, as "risk on" takes a big step backward, as risk would get sold and traders run back into the safety of US paper.
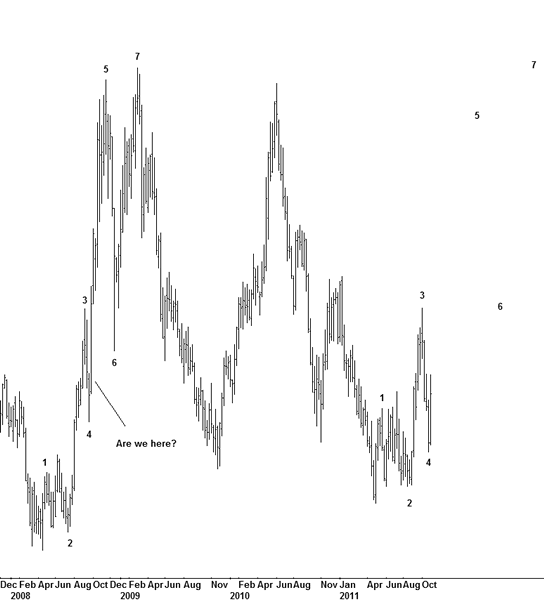
If you go back to the 2008 period, you can see how it started to take on some strength and really took hold, if the analogue remains true today then we are about to see a rather larger move to the upside shortly in the US$, that pretty much is saying that risk markets are about to see a rather substantial downside more.
It's something I am watching, but not exactly going to bet the farm on, expecting a substantial move in the US$ to the upside, would pretty much need a repeat of 2008, to get the same result.
The issue with the US$ price structure, it's the heavy decline we saw from points 3-4, that is a big problem, for the bulls, and pretty much makes this idea a lows odds setup, it's possible, but imo a low odds probability as there has to be so many things going for it, to finally see such a strong move, I think the probabilities are weighted against such a move, but never say never.
As the market continues to wrestle with the 76.50 area, I tend to like the upside here against holding the 76.50 area on a dip, as long as that holds as support, it will suggest more weakness for risk markets.
So going forward, I tend to think the bulls are still in control short term above 76.50
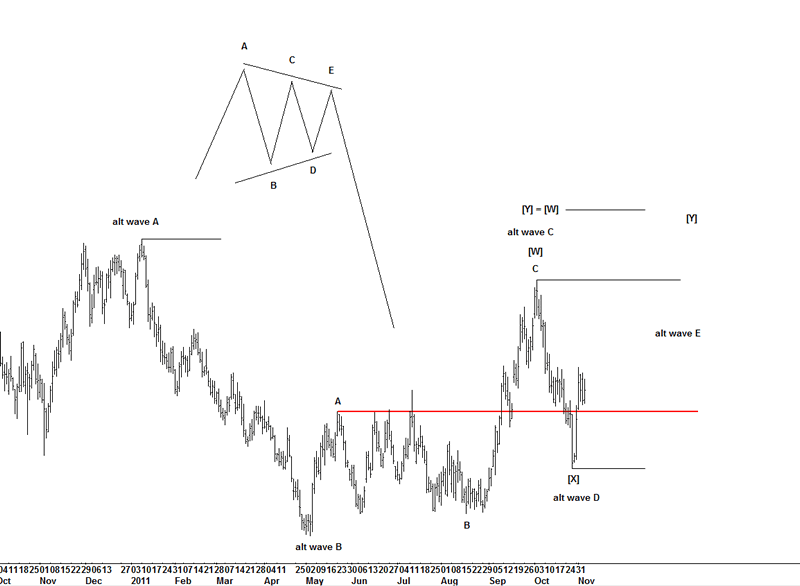
One such idea I tend to prefer is that of a larger WXY wave count, and the 3 wave decline we saw from the Oct 4th high, is that of a X wave and potentially now see towards the Oct 4th high and target area around the 82 handle, that should see a test of the Oct 4th lows in many risk markets, such as the US and European stock markets, as well the risk FX pairs such as AUD/USD, AUD/JPY and NZD/USD, you should also see a move in the EUR/USD pair, as that is the direct opposite to the DX.
The alt idea is that a larger running triangle is being worked and this would be an E wave and which we could see higher prices, the market would stop under the Oct 4th highs around 78.50-79.
So you can see how important it is to follow what the US$ is doing via the DX, as clues from that market will help decide the trend going forward in risk on/off, and also help traders to get in and out of the markets, knowing when to be short or long based of the direction of the US$.
It's such a key component in my daily analysis that I simply can't focus on other markets, unless I have an understanding on what its potential paths are, what its doing plays such a big part in today's markets. I still do think that those traders that are not in tune with the movements of the DX are missing a big component in the daily swings we are seeing.
SPX
We went into this week with 3 working ideas, and we still have those ideas as nothing has changed, expect that the decline that I was expecting came out of the gate straight away on Monday, but on these long term ideas, nothing has really changed dramatically yet.
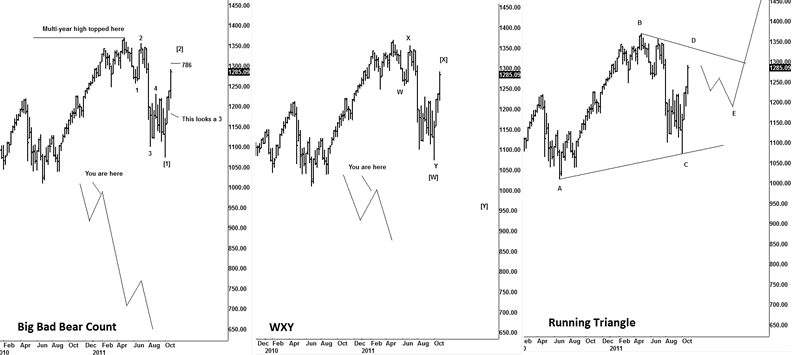
On a scale percentage basis, it's a 40-40-20; with the Big Bad Bear count my least preferred idea.
Now whilst it's a 5 wave looking move, it has many problems with the structure to be considered a natural 5 wave move, but in the interests of being objective, I included it, as over time I hope to narrow these ideas into working ideas, but as the range is so large, I don't exactly expect to get a resolution straight away.
So as you can see, there is more than one option, and whilst there very well maybe a substantial move to the downside setting up, it also might not be what you think, if the DX is the clue to the risk on/off trade, it stands to reason that watching the DX and its potential path will help with US stocks going forward.
By having a number of options, it will give us some options, and most importantly could save us from getting too bearish on the US stock markets, if the DX fails to follow through on the upside.
You may well read about crashes and all sorts coming from other technicians', but those same technicians have been singing the same song sheet for the last 2 years.
The past 2 weeks, have altered that potential crash scenario somewhat, and again we can see a nasty move lower towards the 1000SPX area, (that is my preferred idea), it won't be what the bears think it is, unless the DX joins in and confirms the move, with the damage seen on the US$ already, in its current trend the US$ is guilty until proven innocent, and until it really gets aggressive above the 82 area, only then can you start thinking that risk is going to see a serious event such as the move seen in 2008.
Oil
We are watching an interesting setup now on Oil and something we have been tracking for weeks, and one that members are ready to pounce on, once it starts to show evidence of a breakdown.
With the current move now appearing as 3 waves and back to the 50% retracement area, as well as entering substantial fibbo and structural resistance, we are focused now on looking for a reversal.
The key to this is the suspect 3 wave rally off the Oct lows, as long as that remains so, we tend to think this is setting up for a substantial move lower.
Conclusion
The market delivered on its promise and did what I expected last week and confirmed the move off the Oct 4th lows in risk markets as 3 waves, so we suspect now that we still have more downside and the last swing high most probably marked an important high, and one that we can use for risk control.
Whilst forecasting is never a 100% certainty I do suspect that the highs seen last week will hold and further downside is likely, where over time we hope to eliminate ideas as price confirms or negates those ideas, in the DX as well as the SPX.
We continue to believe the key will come from the strength or weakness going forward for risk on/off trade, in order for the bears to really see substantial downside in risk, the DX will need to get aggressive shortly, and I am still liking the short term bullish case if the DX can hold above the 76.50 area, which is big support.
If a big move is setting up for the US$, I also suspect we get to see a reaction in Oil from the target zone.
It should be an interesting next couple of weeks, as ever we will take our lead from what the US$ does, if something is wrong, then we suspect the clue will come from further DX weakness, that will tells us that if the DX pukes back under the 76.50 area and hard to the downside, then the bears on risk markets, need to respect that and hold back from selling risk markets such as ES, AUD/USD and EUR/USD etc.
As there is little point is selling risk if the US$ is in puke mode, likewise, if you are bullish in risk markets, you don't want to be buying risk in the face of a strong US$, that's going against the trade.
Until next time.
Have a profitable week ahead.
Click here to become a member
You can also follow us on twitter
What do we offer?
Short and long term analysis on US and European markets, various major FX pairs, commodities from Gold and silver to markets like natural gas.
Daily analysis on where I think the market is going with key support and resistance areas, we move and adjust as the market adjusts.
A chat room where members can discuss ideas with me or other members.
Members get to know who is moving the markets in the S&P pits*
*I have permission to post comments from the audio I hear from the S&P pits.
If you looking for quality analysis from someone that actually looks at multiple charts and works hard at providing members information to stay on the right side of the trends and making $$$, why not give the site a trial.
If any of the readers want to see this article in a PDF format.
Please send an e-mail to Enquires@wavepatterntraders.com
Please put in the header PDF, or make it known that you want to be added to the mailing list for any future articles.
Or if you have any questions about becoming a member, please use the email address above.
If you like what you see, or want to see more of my work, then please sign up for the 4 week trial.
This article is just a small portion of the markets I follow.
I cover many markets, from FX to US equities, right the way through to commodities.
If I have the data I am more than willing to offer requests to members.
Currently new members can sign up for a 4 week free trial to test drive the site, and see if my work can help in your trading and if it meets your requirements.
If you don't like what you see, then drop me an email within the 1st 4 weeks from when you join, and ask for a no questions refund.
You simply have nothing to lose.
By Jason Soni AKA Nouf
© 2011 Copyright Jason Soni AKA Nouf - All Rights Reserved
Disclaimer: The above is a matter of opinion provided for general information purposes only and is not intended as investment advice. Information and analysis above are derived from sources and utilising methods believed to be reliable, but we cannot accept responsibility for any losses you may incur as a result of this analysis. Individuals should consult with their personal financial advisors.
© 2005-2022 http://www.MarketOracle.co.uk - The Market Oracle is a FREE Daily Financial Markets Analysis & Forecasting online publication.