


Stock Markets Now Most Vulnerable Position For Major Fall Since 2008
Stock-Markets / Financial Crash Nov 09, 2011 - 07:59 AM GMTBy: Garry_Abeshouse

 The bull trap has now been set and the rally in equities is showing definite signs of petering out with the USD as a contrary indicator since mid October, indicating strong signs of base building.
In fact as I write these words equities are falling due to the growing realisation that no solution to the European economic and financial crisis is in the offing.
It was John Maynard Keynes, who in 1945 famously said – “Owe your banker £1000 and you are at his mercy; owe him £1 million and the position is reversed.” These days it’s more like ''If you owe $500 million to a bank, the bank owns you. But if you owe $500 billion to a bank, then you own that bank!'' So much for the euro and bank equities.
In my last market commentary on September 30th 2011, my overview alluded to an extended bear market rally coming to an end:
“As I look over a broad cross-section of daily, weekly and monthly charts all I see is an ever expanding series of complete and/or maturing broadening/diamond tops and upward wedge formations – all with strongly bearish connotations. Historically, I have always associated these types of broadening tops and diamond formations with times of high volatility and confusion, which when resolved, result in very fast and dramatic downward moves. So when these chart formations have been confirmed as such, especially on the longer term on monthly charts, you know the ‘Bear’ is truly back in force. Perhaps the politicians and bankers will try their best to delay a full return to a bear market, but it is highly unlikely they will be able to stop it.”
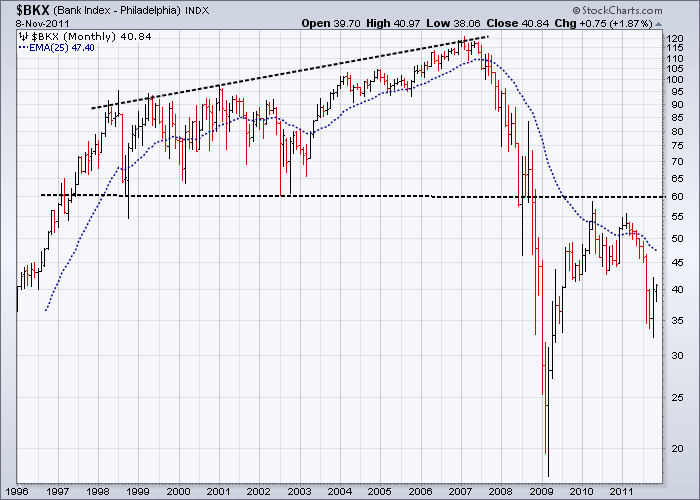
One of the key charts, The Philadelphia banking Index showed the breakdown of a 10 year top, where “ Prices have already collapsed below the recent two year support indicating a return to what will probably be a testing of the 2009 lows. It is very difficult to even try and imagine a longer term bullish scenario for these two charts, even if there is a stronger rally from here.”
As you can see from the charts below, the current weak rally in equities has done nothing to create a more bullish outlook.
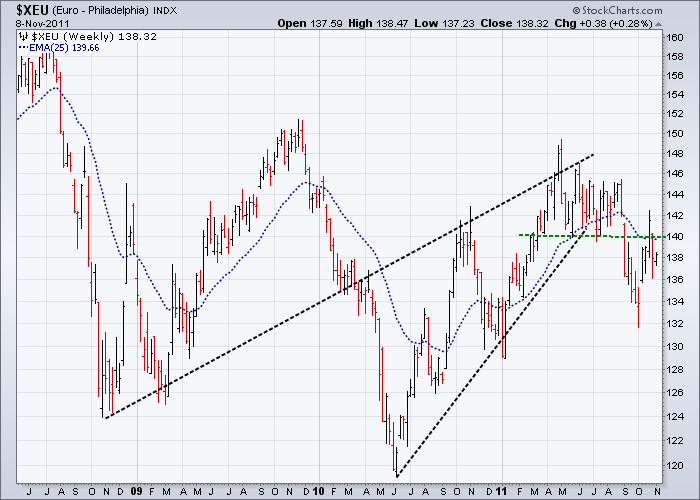
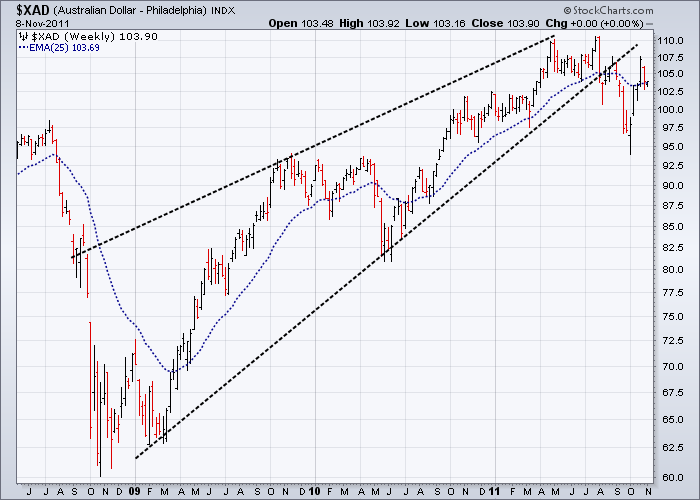
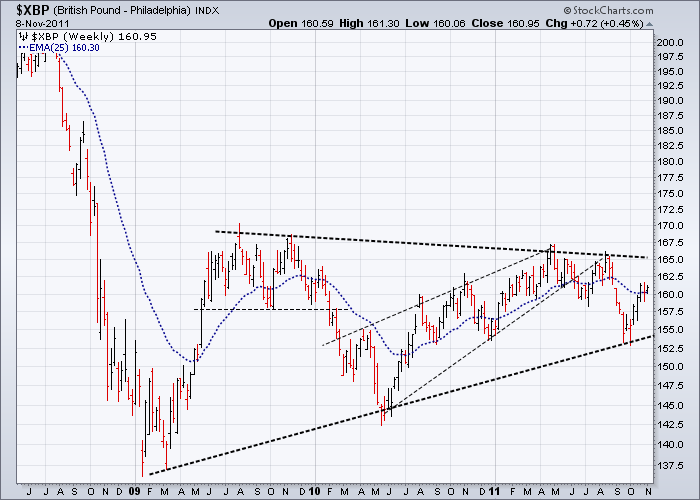
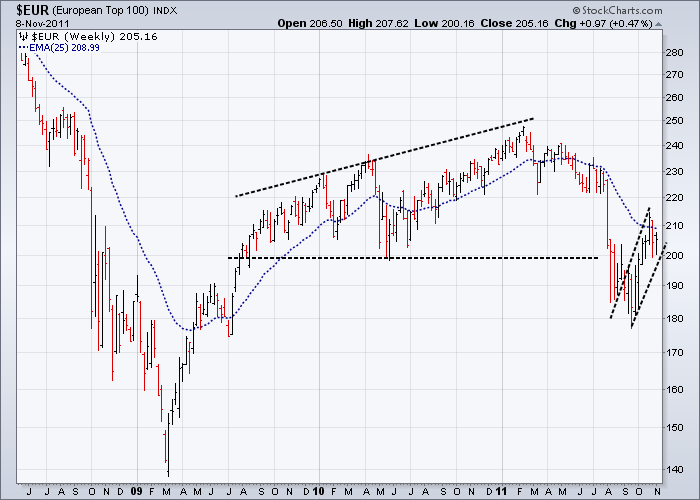
This view can be best illustrated by the associated weakness in the Euro. The longer the Euro tries and fails to stay above the 1.400 resistance, the more likely this resistance level will hold, with the most likely scenario a testing of the 2010 lows. I expect a similar outcome for the AUD and British Pound as well.
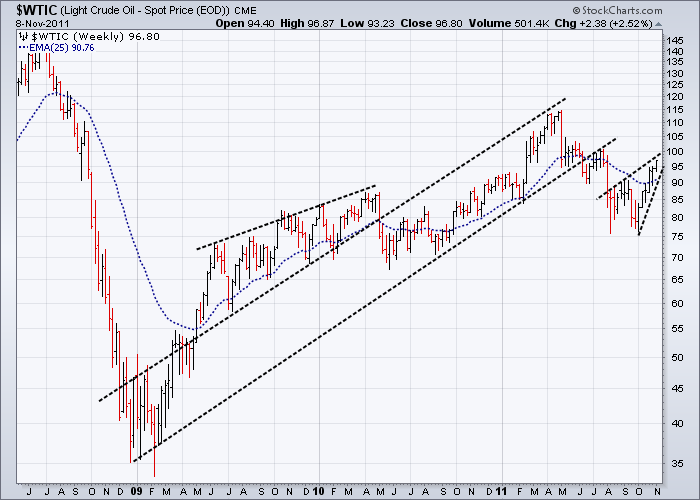
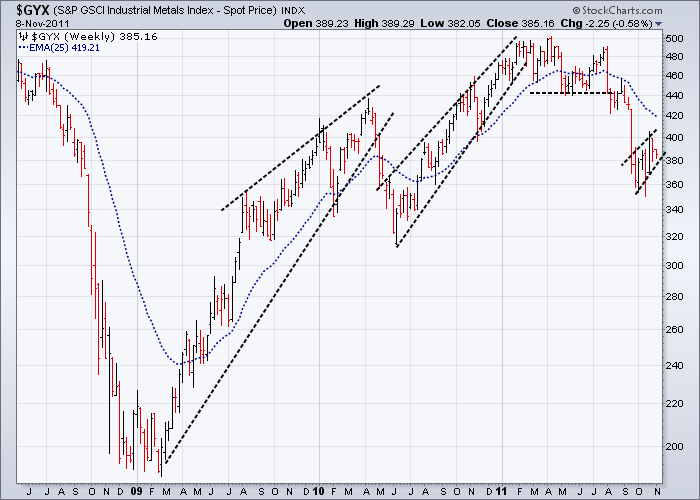
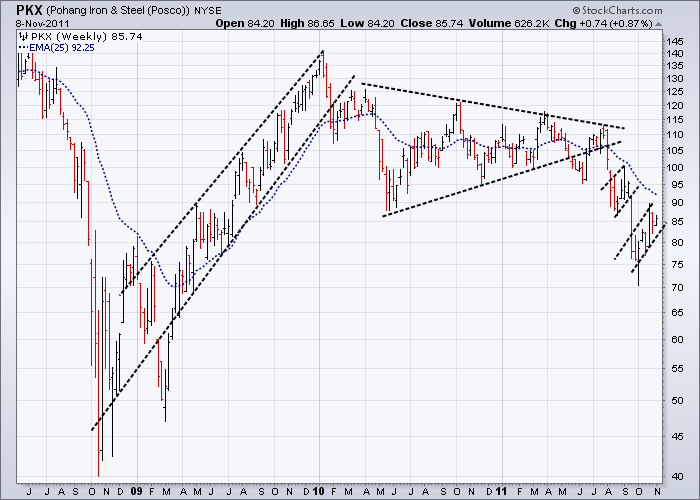
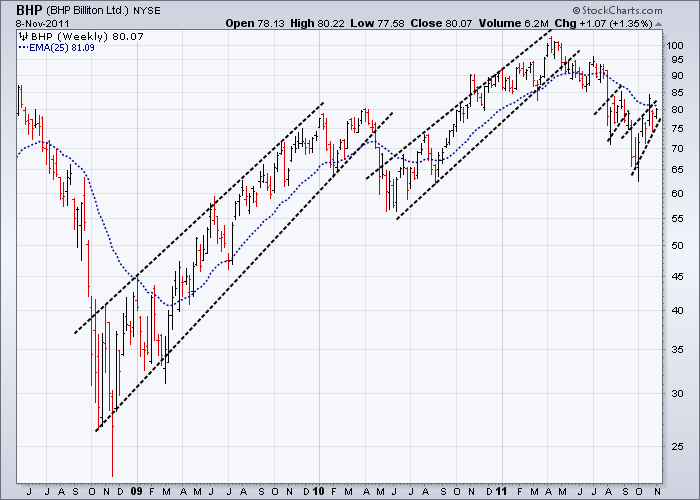
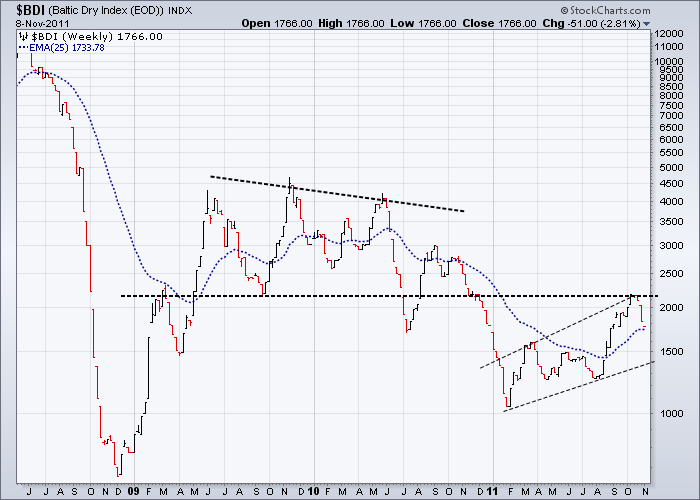
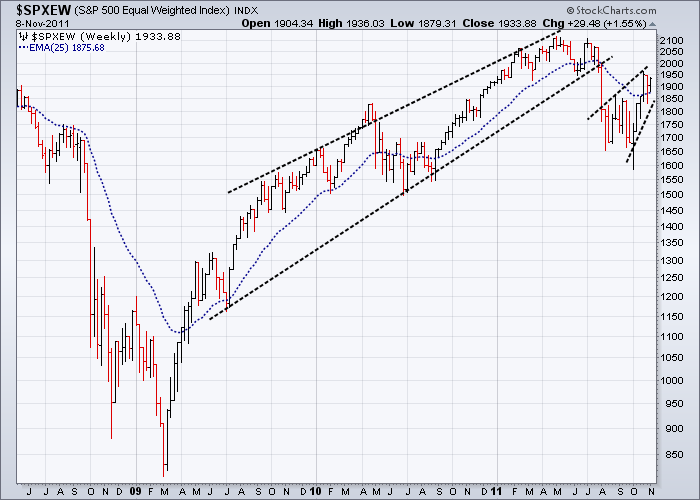
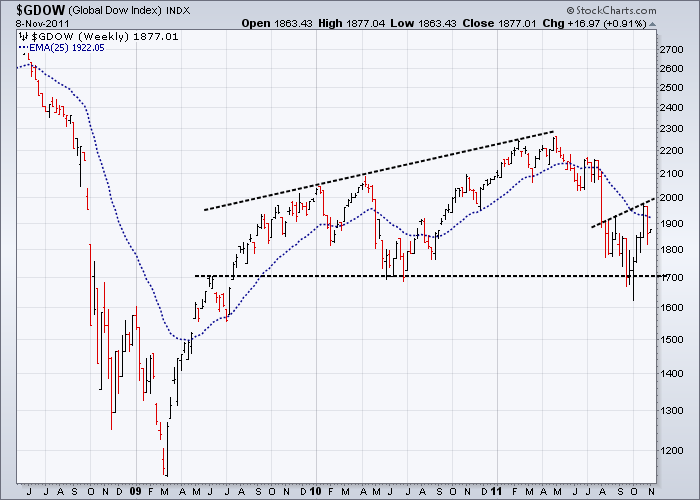
Notice how many of the disparate group of charts below, representing a cross-section of vulnerable ‘canary-in-the-coal-mine’ market indicators, have very similar chart patterns, all suggesting bearish outcomes. When any one of these go the rest will follow – and probably soon
Oil
Industrial Metal Prices
Steel
Mining, Oil and Gas
Industrial
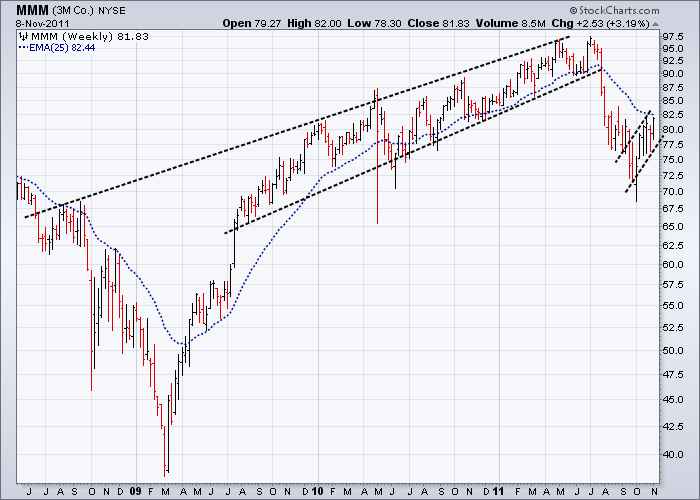
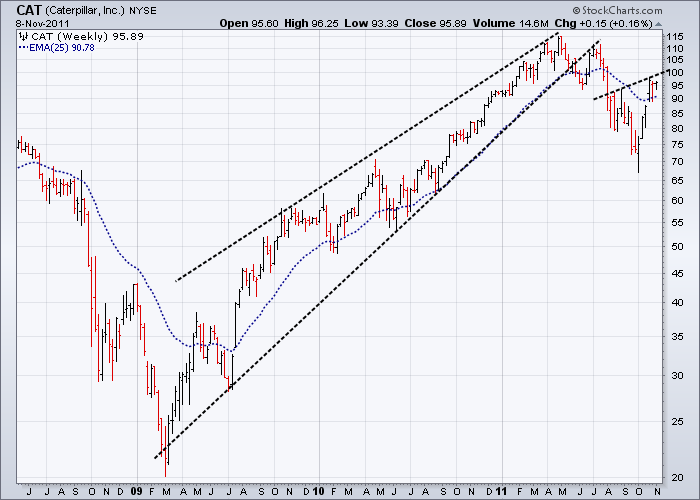
Heavy Machinery
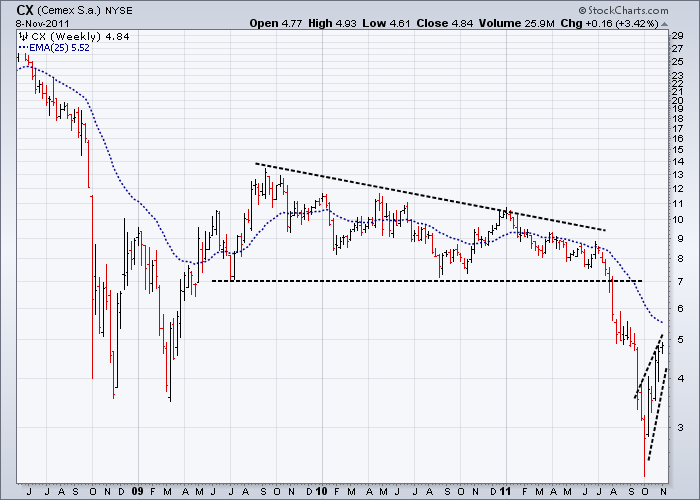
Building Materials
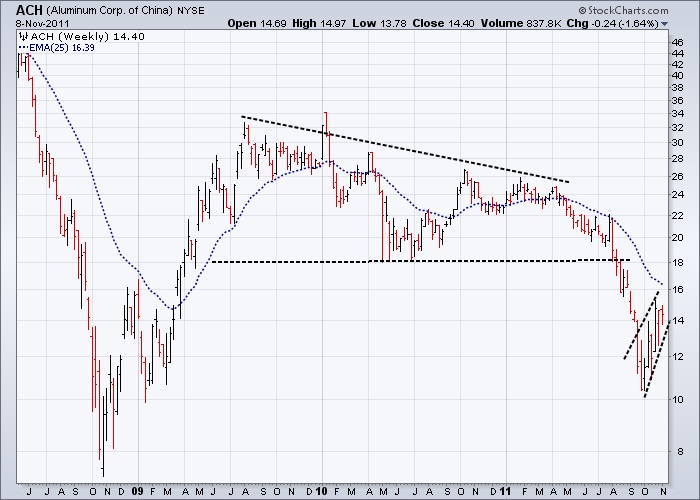
Aluminium
Shipping
Top 500 USA Companies – Equal Weighted
Top 100 European Companies
Global top 150 companies – Equal weighted
Till next time.
Garry Abeshouse
Technical Analyst.
Sydney
Australia
I have been practicing Technical Analysis since 1969, learning the hard way during the Australian Mining Boom. I was Head Chartist with Bain & Co, (now Deutsch Bank)in the mid 1970's and am now working freelance. I am currently writing a series of articles for the international "Your Trading Edge" magazine entitled "Market Cycles and Technical Analysis".
I have always specialised in medium to long term market strategies and after discovering the excellent Point & Figure Charts from Stockcharts.com in mid 2008, have concentrated on this style of charting ever since.
© Copyright Garry Abeshouse 2011
Disclaimer: The above is a matter of opinion provided for general information purposes only and is not intended as investment advice. Information and analysis above are derived from sources and utilising methods believed to be reliable, but we cannot accept responsibility for any losses you may incur as a result of this analysis. Individuals should consult with their personal financial advisors.
© 2005-2022 http://www.MarketOracle.co.uk - The Market Oracle is a FREE Daily Financial Markets Analysis & Forecasting online publication.