


Final Stock Market Rally Before the Big Leg Down is Near End
Stock-Markets / Stock Markets 2011 Nov 14, 2011 - 01:04 AM GMTBy: David_Banister

 Back on October 3rd, I penned a public article forecasting a major low in the SP 500 to occur around 1088. The SP 500 had been declining from the 1370 highs this May and was in the 1130’s and nearing its final descent in a corrective pattern. The next day, the market bottomed intra-day at 1074 and closed north of 1100. Since that time, we have rallied impressively to a high of 1292, with a strong pullback to 1215, and now what I believe is the finally rally to a major top formation.
This current rally is part of a normal retracement of the 1370 highs to 1074 lows that similarly occurred in the 2008 rally off the first major market drop. One would expect this rally to take a few months to complete from October 4th and likely peak sometime between now and Christmas in the 1292-1320 ranges as outlined below.
First you must understand that my forecasts are largely based on human behavioral patterns and not economic news or European headlines. The crowd commonly buys and sells in the same fear and greed swing patterns over and over again throughout history. Once you understand these patterns, you can make pretty strong educated guesses on the direction and pivot highs and lows within a few percentage points. Other than those wave patterns, there are other indicators I use to confirm what I think I’m seeing, so let’s review:
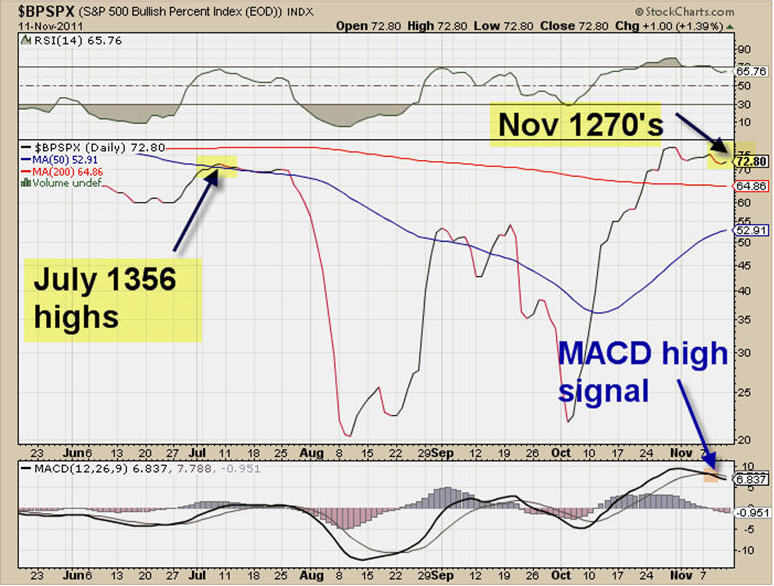
1. The bullish Percent Index readings are now at 72%, which typically is an area that marks a rally high in the markets. These indicators tell you how many of the SP 500 stocks have bullish point and figure charts. Typically a reading over 70% is way overbought and all bulls are on board, and a reading below 30% is the opposite. The market bottomed this summer twice on August 8th and October 4th as these readings were sub 30%. The market topped in July at 1356 as this reading was over 70%. With my wave patterns and this reading now again over 70%, it’s a strong warning of an imminent reversal.
2.Sentiment Indicators are now back to full on bullish. In the most recent AAII survey, we have nearly 46% of those polled bullish, up from an extreme low of 24% in early October near the market lows. In addition, the Bears in this survey are at a near extreme low of 24% of those polled, leaving the ratio at almost 2 to 1 bulls. This is another warning flag.
The Bullish Percent Index chart is below with some notations:
Stock Market Forecast
Longer term, my best view right now is that this is a counter-trend bounce off the 1074 lows that will give way to another big down leg.
Here is my reasoning:
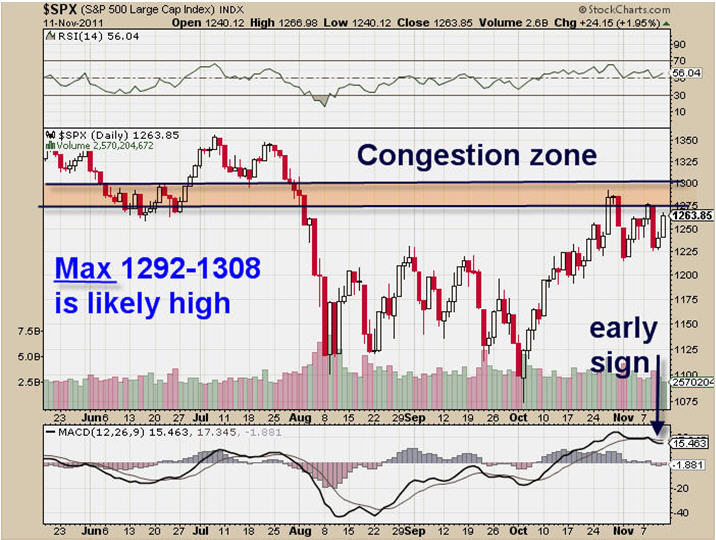
First, look at the SP 500 chart. I show the congestion zone from 1275-1300. My Fibonacci and wave targets have been 1292/93-1306 for a few weeks; we hit 1292/93 once and fell hard. The market is trying to work back up there in this final E wave up I think. So far 1274-76 were hit (One of my targets) and we will see if it can run to 1292/93 and the final is 1306-08.
Stock Market forecast Prediction
This is a B wave rally or wave 2 rally off the 1074 lows. We are in a bear cycle bounce.
From March of 2009 (I forecasted a market low on Feb 25th 2009), the market rallied from 666 to 1370 in 3 clear waves, ABC. Those are corrective patterns of a bear market. The market topped at .786% of the 2007 highs to 2009 lows at 1370 with Bin Laden’s death, a seminal event.
Since then— 5 waves down (impulsive) to 1074 marked a 38% retrace of the Bear rally that went from 666 to 1370.
This is a counter-trend rally from 1074 to 3 potential pivot areas. 1292 (which I forecast and already hit), 1306-1308, and max 1320. 1306-08 is probably the max in my views.
Why?
A wave: 1074-1233 wave A from October 4th lows. (I forecasted a bottom on October 3rd)
B wave: 1233-1195 wave B (A mild .236% retrace of A wave)
C wave: 1195- 1292, 1308, 1320 wave C (Where wave c is either .618, .71, or .786 of wave A (159 points 1074-1233))
This recent pattern in a more microcosmic view is much like the ABC rally from 666 to 1370. There the A wave was huge and went from from 666 to 1221. The B wave 1221-1010; and then the C wave 1010-1370. That C wave was only 64% of the A wave. All of those pivots, 1010, 1221, 666, 1370 etc. have Fibonacci relationships to prior market highs and lows.
I’m looking for this current counter-trend rally to mimic the nature of the 2009-2011 ABC Rally. That means this final pattern up now we are in from 1195 pivot would be much less substantial than the rally from 1074-1233. That is why I look for 1292-1306 ranges (same forecast I had weeks ago) as a top between now and Christmas at best. At any time this market could top and crack, so I’m laying it out as best as I can.
Bottom Line: Market is trying to complete a counter-trend rally which so far peaked at 1292/93 and is struggling to get back up there or maybe a tad higher before the markets lose strength. Many indicators short term are peaking as well, and everyone should be on guard. If you’d like to be forewarned of major tops and bottoms in Gold, Silver, and the SP 500 with outside the box thinking, check us out at www.MarketTrendForecast.com for a great offer.
Our normal price is $327 per year, however, in the spirit of the holiday’s and the upcoming “Black Friday” shopping day, we are offering an early Holiday Present with a large discount of $100 off the annual price for just $227 for the first year of your TMTF subscription.
You can get 3-5 updates a week on Gold, SP500, and Silver by visiting www.MarketTrendForecast.com
Dave Banister
CIO-Founder
Active Trading Partners, LLC
www.ActiveTradingPartners.com
TheMarketTrendForecast.com
Dave Banister is the Chief Investment Strategist and commentator for ActiveTradingPartners.com. David has written numerous market forecast articles on various sites (SafeHaven.Com, 321Gold.com, Gold-Eagle.com, TheStreet.Com etc. ) that have proven to be extremely accurate at major junctures.
© 2011 Copyright Dave Banister- All Rights Reserved
Disclaimer: The above is a matter of opinion provided for general information purposes only and is not intended as investment advice. Information and analysis above are derived from sources and utilising methods believed to be reliable, but we cannot accept responsibility for any losses you may incur as a result of this analysis. Individuals should consult with their personal financial advisors.
© 2005-2022 http://www.MarketOracle.co.uk - The Market Oracle is a FREE Daily Financial Markets Analysis & Forecasting online publication.