


Stock Markets in a Pre-Crash Pattern
Stock-Markets / Financial Markets 2011 Dec 24, 2011 - 11:07 AM GMT

 -- The VIX appears to be nearing completion of a doubly indicated bullish Descending Wedge pattern on December 27. It will then have completed a Master Cycle low, beginning a new bullish cycle pattern for the VIX. The master cycle low appears to have been delayed, but I wish to assure you that the low will occur within turn window allowed for it. What follows may be a breakout above the wedge as early as the end of next week.
SPX is in a pre-crash pattern…
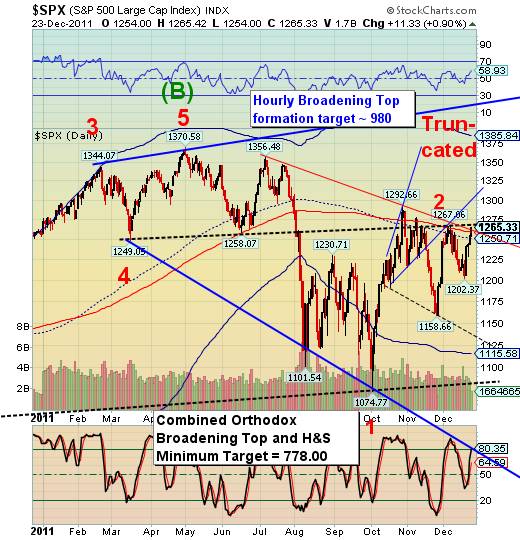
-- The /SPX "Santa rally" may end sooner than most people think. The reason for this is a cluster of resistances that the SPX has been battling on the upside since late October. The top resistance, which is not been surpassed is the downtrend line from the 1356.48 high and capping four prior rallies before today. The second resistance is the 200 day moving average at 1259.17. The SPX has a tenuous hold only six points higher. The final resistance is mid-cycle support/resistance at 1250.69. A drop below that would trigger a cyclical model sell signal.
The lack of alarm by investors may be attributed to the normal positive seasonality expected to last through the end of the year in the markets. Or it may be attributed to this week's lows in the VIX, giving a false sense of security and calm. The cycles, however, give a far different picture. The potential for market crash by year-end is still very high.
… The NDX appears even more bearish
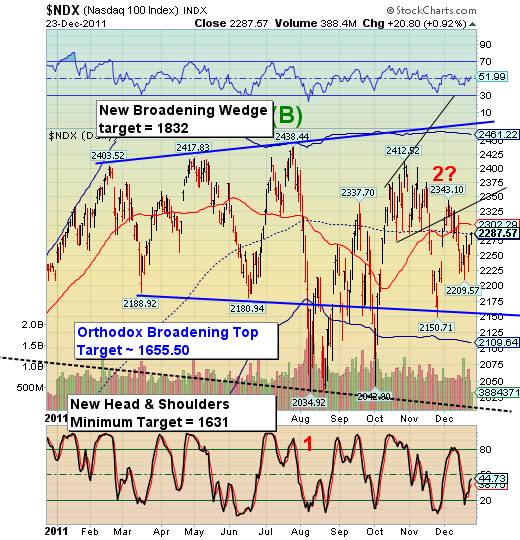
-- The fact that the NDX is well below 50 day moving average (red line) at 2302.20, below its 200 day moving average at 2287.60. It is only above mid-cycle support/resistance at 2285.40, which hardly perturbs the complacency among traders. This week's attempt at buying the dip has not pushed the NDX above its important resistance levels.
Folks, this is as bearish as it gets. It is very likely that the NDX may start a flash crash by year-end.
The Euro is below cyclical resistance.
-- The Euro has begun its plunge towards parity with the dollar. After having crossed the Head and Shoulders neckline in cycle bottom support/resistance at 132.50, it is corrected only so far as cycle bottom resistance, and not back to the neckline. This shows acute weakness in the euro.
Since early May the Euro has had an increasing correlation with the Standard & Poor's 500 index. There is a strong implication that as the Euro Zone crumbles, so will the financial markets in the United States as well.
The cycles suggest that the Euro may attempt to rally through the end next week…or crash!
The US Dollar finds support at its neckline.
-- The US dollar has made a breakout of its inverted Head and Shoulders pattern. It spent last week retesting its neckline and now appears to be resting atop its cycle top support/resistance at 79.90. The retracement appears finished in the dollar is set to go much higher.
While I have listed the minimum Head and Shoulders target of 87 on the chart, Head and Shoulders bottoms are quite powerful and may produce rallies as high as 20% or 30%.. (Source: Encyclopedia of Chart Patterns, by Thomas N. Bulkowski, page 276) The Broadening Bottom minimum gain nicely matches the minimum target for the inverted Head and Shoulders pattern with an average 20% gain.
Gold reveals a new Head and Shoulders pattern.
-- Although gold made a stab at midcycle resistance at 1649.87 last week, it did not close a single day above its 200 day moving average at 1620.95. Much ado was made about the drop in the price of gold over the last two weeks. This culminated in some outright giddy commentary when gold made a stab above the 200 day moving average. It's been rather quiet since then.
The Head and Shoulders neckline is waiting to be taken out by gold next week. The cycle model suggests that gold may continue its decline next week to breach its Orthodox broadening top lower trendline at 1500.00.
The current cycle now calls for a significant low in gold by the end of January. The decline may resume next week.0
U.S. Bonds are testing critical support.
-- This week USB tested intermediate-term trend support at 142.49. Just below it at approximately 142.00 lies the uptrend line for this rally. This may be the strong reversal that we have been waiting for. The cycles model calls for a trading cycle low between Friday, December 23 and Monday, December 26. Since December 26 is a holiday, I suggest that the cycle low may be in today.
I remain bullish, since the cycles support the uptrend through the end of January, if not later. In fact, the Broadening Wedge formation strongly suggests an acceleration in the price of USB.
Some traders are trying to make their Christmas bonus in oil.
-- On Thursday West Texas Crude lurched towards its downtrend line (red) but could not close above 100.00. This is the final resistance for oil, which remains bullish until now. The question is, can oil may bullish until year end?
For the most part, West Texas crude appears to be correlated with our domestic equities. That suggests that oil may be linked with stocks in a decline lasting through the year end. It also appears that oil may be starting a crash pattern along with our domestic equities as early as next week.
China stocks retraced off the lows.
The Shanghai Index is in a retracement pattern below its massive Head and Shoulders neckline at 2307.15. It is possible that the pattern is unfinished, since there is an important trading cycle low which is due today. Therefore, the cycles suggest that there may be a bounce into the year end for the Shanghai index. It is suggested that the Head and Shoulders neckline may be tested in the process.
The Bombay index is at a loss for the year.
The Bombay index may be trying to regain lost ground as it seeks to finish its Primary Cycle pattern by mid next week. It may attempt to reach intermediate-term trend resistance at 16,349.37. From there, a mighty crash pattern resumes.
Thanks to Mr. Jamal who encouraged me to apply the cycle model to the BSE.
A last ditch effort to save the banks may be over.
The BKX appears to have completed its long, drawn-out correction since early October. Unfortunately, this rally may have peaked a week too soon. It appears that the selloff in the BKX may start as early as Tuesday.
Normally when third waves are extended, fifth waves usually match the width of the triangle or the length of wave 1. In this case, however, a massive head and shoulders pattern is a dead giveaway that the banking index may plunge to single digits, if not to zero. In the meantime, what bankers are left seem to be determined to get their final year end bonus.
Happy Holidays!
Regards,
Tony
Our Investment Advisor Registration is on the Web
We are in the process of updating our website at www.thepracticalinvestor.com to have more information on our services. Log on and click on Advisor Registration to get more details.
If you are a client or wish to become one, please make an appointment to discuss our investment strategies by calling Connie or Tony at (517) 699-1554, ext 10 or 11. Or e-mail us at tpi@thepracticalinvestor.com .
Anthony M. Cherniawski, President and CIO http://www.thepracticalinvestor.com
As a State Registered Investment Advisor, The Practical Investor (TPI) manages private client investment portfolios using a proprietary investment strategy created by Chief Investment Officer Tony Cherniawski. Throughout 2000-01, when many investors felt the pain of double digit market losses, TPI successfully navigated the choppy investment waters, creating a profit for our private investment clients. With a focus on preserving assets and capitalizing on opportunities, TPI clients benefited greatly from the TPI strategies, allowing them to stay on track with their life goals
Disclaimer: The content in this article is written for educational and informational purposes only. There is no offer or recommendation to buy or sell any security and no information contained here should be interpreted or construed as investment advice. Do you own due diligence as the information in this article is the opinion of Anthony M. Cherniawski and subject to change without notice.
Anthony M. Cherniawski Archive |
© 2005-2022 http://www.MarketOracle.co.uk - The Market Oracle is a FREE Daily Financial Markets Analysis & Forecasting online publication.