


I Stand By Silver $140 In 2012
Commodities / Gold and Silver 2012 Jan 26, 2012 - 07:36 AM GMTBy: Hubert_Moolman

 There is a well-established relationship between how silver and gold trade. They often trade similar in the same time period, but also at similar milestones, although those milestones are sometimes reached at different times. This can cause silver or gold to be the leading indicator, depending on the particular milestone.
I have previously used this relationship to predict how silver will trade. Below, is an extract of that update:
Currently, there is another situation in the silver and gold market that provides an opportunity to predict how silver prices might trade over the coming months. I have pointed this out before, in a previous article. Here, I would just like to provide an update, and add a few more thoughts.
This situation or opportunity revolves around the 1980 all-time high for both metals. Gold passed its 1980 all-time high during 2008, while silver is yet to do so. By looking at the pattern of how gold passed its 1980 high, we can predict how silver might do it as well.
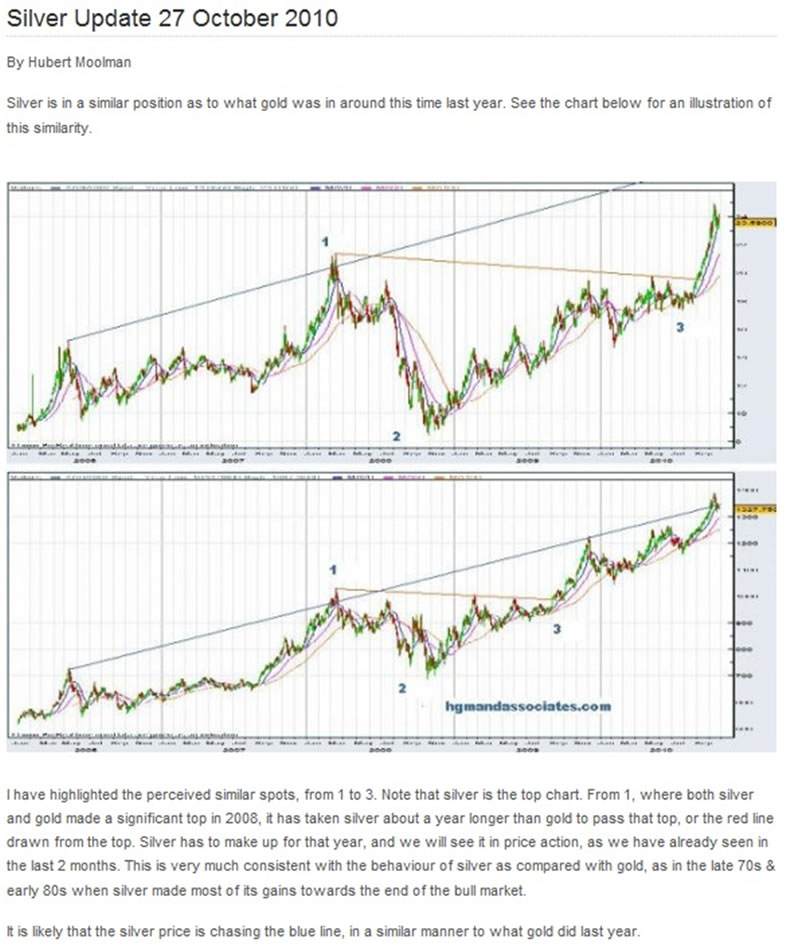
Below, is a comparison of silver and gold around their respective 1980 highs:
From the chart, you can see there is similarity in how gold and silver approached their 1980 high. Gold and silver made a triangle-type pattern (marked 1 -3) just before it reached the 1980 all-time high. When it came out of that triangle pattern, it rallied strongly to the 1980 high, which started the formation of a flag-type pattern (marked 1 – 9).
It appears that silver is now past point 9 (29 December 2011), and will now be eyeing that $50 level.
Market conditions often cause silver to fall behind gold, for quite some time, where after, silver normally catches-up in a big way. The fact that silver is still caught-up in a trading range lower than its 1980 high, at least four years longer than gold already, provides a classic opportunity for silver to follow that “catching-up pattern” and zoom to multiples of its 1980 high.
With gold having passed $1700 (twice the 1980 high of $850) already, given the above analysis, it stands to reason that $100 (twice the 1980 high of $50) silver is virtually guaranteed.
There are many indicators suggesting that we are close to a point where silver might catch –up with gold, relative to its 1980 high, in a big way. My recent analysis of the gold/silver ratio also seems to suggest this. So, as things stand, I expect silver to outperform gold for most of this year, and I stand by my target of at least $140 silver by the end of 2012.
For more detailed analysis of gold, silver and the Dow, you are welcome to subscribe to my free or premium service.
Warm regards and God bless,
Hubert
http://hubertmoolman.wordpress.com/
You can email any comments to hubert@hgmandassociates.co.za
© 2012 Copyright Hubert Moolman - All Rights Reserved
Disclaimer: The above is a matter of opinion provided for general information purposes only and is not intended as investment advice. Information and analysis above are derived from sources and utilising methods believed to be reliable, but we cannot accept responsibility for any losses you may incur as a result of this analysis. Individuals should consult with their personal financial advisors.
© 2005-2022 http://www.MarketOracle.co.uk - The Market Oracle is a FREE Daily Financial Markets Analysis & Forecasting online publication.