


Stock Market Long Term Bull Market Elliott Wave Count
Stock-Markets / Elliott Wave Theory Jan 30, 2012 - 12:20 PM GMTBy: David_Banister

 I have to be honest that I am grappling with a few possible counts since the March 2009 Bull market commenced in terms of the big picture.
With Elliott Wave Analysis, you have to anticipate, monitor, and then adjust. Most of the time I go with my instinct and then only adjust if it looks like I was way off the tracks. The only time I tend to get way off the tracks is when I read too many opinions, so I’ve shut myself off from reading other’s opinions and below is my gut right now:
I know I have labeled one option as the 1074 lows being primary wave 2, with primary wave 3 underway since (1074 to current). However, I have to admit my instincts still tell me that the 1074 lows may have been primary wave 4, and we are in primary wave 5 up now.
Whether it was 2 or 4 is not super important short term because we would either be in a Primary 3 up or Primary 5 up now which is bullish either way. However… if it’s a primary 5 up, then it changes the longer term pictures and also 5th waves can be difficult to assess.
There is another rule that says wave 3 can’t be the shortest of waves 1, 3 and 5 (All up waves). Therefore, if we are in primary 5 up now from the 1074 lows then we can’t rally more than 360 points from the 1074 lows (Wave 3 was 360 points).
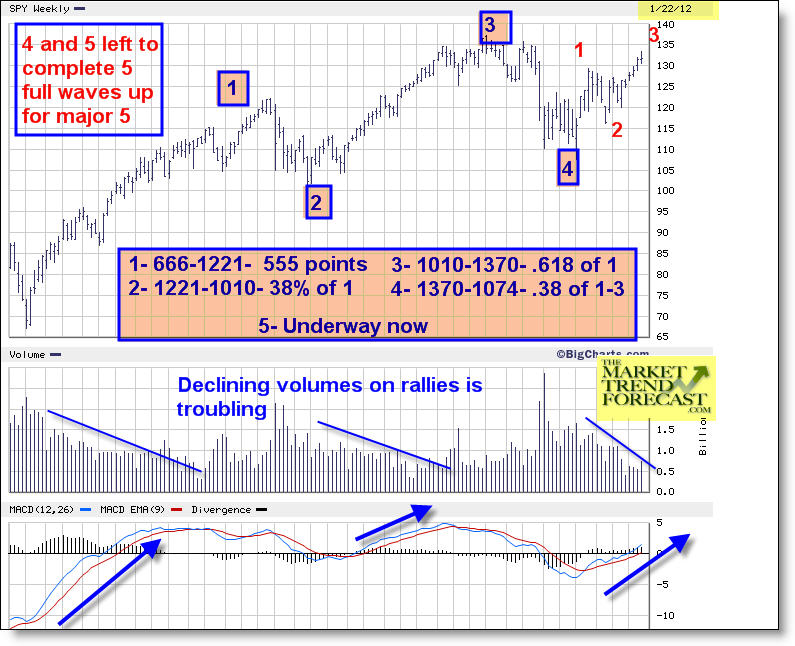
So here is the possible count if this is Primary 5 from the March 2009 lows with normal fibonacci relationships:
666 to 1221- 1
1221-1010- 2 (38% of 1)
1010-1370- 3 (61.8% of 1)
1370-1074- 4 (38% of 1-3)
1074-??? – 5 (Normally 50-61% of 1-3)
So if wave 5 cant be longer than wave 3, and let’s say wave 5 is 50% of waves 1-3… that would put a top target at about 1426 on the
SP 500 index. That would make wave 5 just shorter than wave 3 following the rules and would complete 5 full waves.
So that is what I’m grappling with because if this is a primary wave 5 up from the Oct 2011 lows of Primary 4… then we would need to be on our toes for a bull market pivot top. If its primary wave 3 up , then we have much further to stretch.
Right now, the evidence is leaning to this being primary 5 up… below is my chart and I will keep you updated. The volume, MACD, and other indicators will help point the way.
Note how the volume has been declining on every primary wave rally 1, 3, and 5 so far. Note how the MACD line uptrends on each primary wave rally as it is now…
Stay tuned
If you’d like to stay ahead of the curve on Gold, Silver, and the SP 500 on a consistent basis, take a look at www.MarketTrendForecast.com , where you can sign up for occasional free reports and/or take advantage of a temporary 33% off coupon to join us!
Dave Banister
CIO-Founder
Active Trading Partners, LLC
www.ActiveTradingPartners.com
TheMarketTrendForecast.com
Dave Banister is the Chief Investment Strategist and commentator for ActiveTradingPartners.com. David has written numerous market forecast articles on various sites (MarketOracle.co.uk, 321Gold.com, Gold-Eagle.com, TheStreet.Com etc. ) that have proven to be extremely accurate at major junctures.
© 2012 Copyright Dave Banister- All Rights Reserved
Disclaimer: The above is a matter of opinion provided for general information purposes only and is not intended as investment advice. Information and analysis above are derived from sources and utilising methods believed to be reliable, but we cannot accept responsibility for any losses you may incur as a result of this analysis. Individuals should consult with their personal financial advisors.
© 2005-2022 http://www.MarketOracle.co.uk - The Market Oracle is a FREE Daily Financial Markets Analysis & Forecasting online publication.