


Tax Receipts And Economic Expansion They Don't Add Up
Economics / US Economy Feb 18, 2012 - 07:13 AM GMTBy: Tony_Pallotta

 Taking economic data at face value "trusting" the seasonal adjustment is comparable to looking at an income statement and ignoring cash flow. In other words if the income statement says a company generated a profit well the cash flow will be there.
In the case of US economic data the closest thing we have is monthly tax receipts. I will be digging more into this data in the coming weeks and months to get a better sense just how well the economy is doing. For now I wanted to share an analysis based purely on tax receipts.
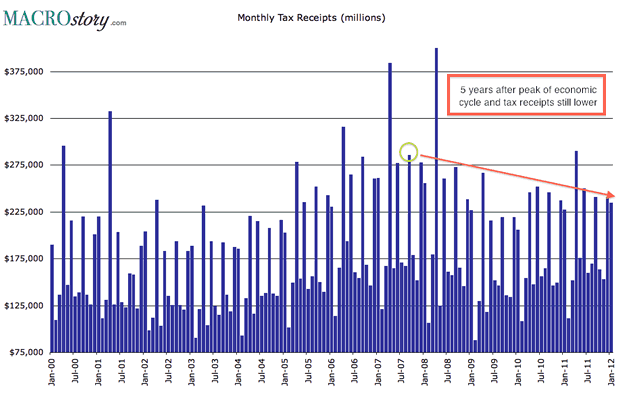
Receipts Still Below 2008 Levels
Four years since the start of the recession and tax receipts are still below 2008 levels. It is no wonder considering that much of the growth in the labor market is low income part time positions. The BLS may count these jobs in monthly non farm payroll but it is masking real economic growth.
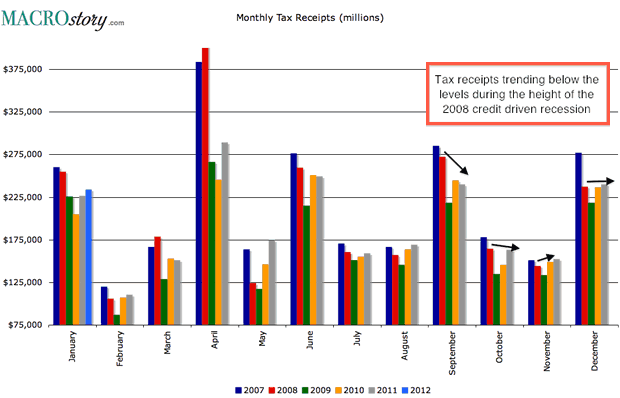
Here's another analysis of tax receipts looking at each month for the periods 2007-2011 (2012 included for January). The 2008 recession began in December 2007 per the NBER but the height of contraction was in September 2008. Notice how current tax receipts are struggling to get back to those levels. Yet somehow seasonal data says the economy is expanding.
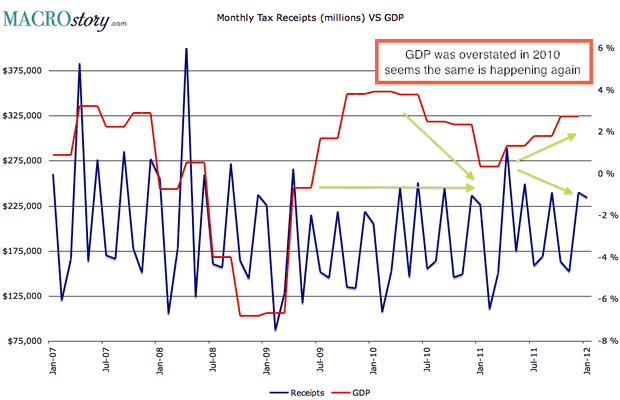
GDP Looks Overstated
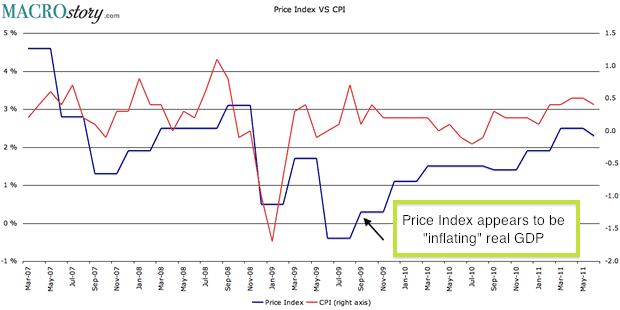
In a prior post (Is The Price Index Inflating Real GDP) I discussed how GDP was being overstated simply by underestimating the different between nominal and real GDP or inflation. The price deflator used by the BEA has lagged that of CPI and therefore one could argue it is overstating real GDP by understating inflation.
The following chart compares real GDP to monthly tax receipts would support that theory. Notice the period during 2010 and the latter part of 2011 where the two diverge. It is not stimulus spending as that happened between 2008-2009.
By Tony Pallotta
Bio: A Boston native, I now live in Denver, Colorado with my wife and two little girls. I trade for a living and primarily focus on options. I love selling theta and vega and taking the other side of a trade. I have a solid technical analysis background but much prefer the macro trade. Being able to combine both skills and an understanding of my "emotional capital" has helped me in my career.
© 2012 Copyright Tony Pallotta - Disclaimer: The above is a matter of opinion provided for general information purposes only and is not intended as investment advice. Information and analysis above are derived from sources and utilising methods believed to be reliable, but we cannot accept responsibility for any losses you may incur as a result of this analysis. Individuals should consult with their personal financial advisors.
© 2005-2022 http://www.MarketOracle.co.uk - The Market Oracle is a FREE Daily Financial Markets Analysis & Forecasting online publication.