


The Face of Gold and Silver Price Volatility
Commodities / Gold and Silver 2012 Mar 07, 2012 - 02:56 AM GMTBy: Jeff_Clark

 Jeff Clark, Casey Research writes: On February 29, gold dropped 4.8% and silver 6.2% (based on London fix prices). That's quite the fall for one day. We've seen prices that have risen that much, too. But as I'm about to show, these ain't nothin', baby.
Based on our experience, we've been saying for some time that volatility will increase as the markets fight their way to the mania phase of this cycle - and that once there, the gyrations will jump even higher. This call doesn't exactly require one to go out on a limb; it makes sense since more investors will be crowding in - and volatility was high in the 1979-'80 mania.
First, let's put last Wednesday's big plunge in perspective. Here's a picture of the daily changes in the gold price since 2003, based on London fix prices. (This chart is very busy, but I want to show the bulk of the bull market in one visual.)
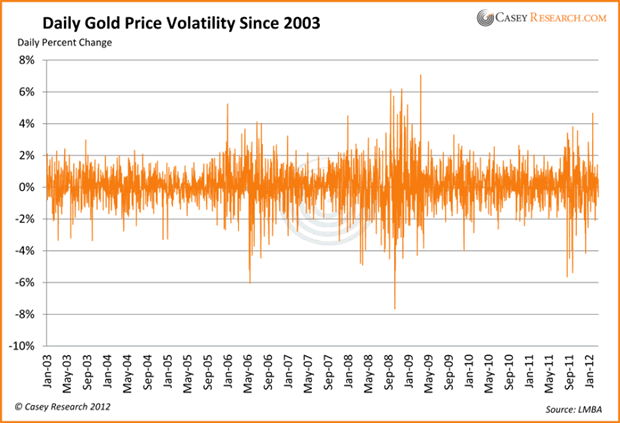
A 4.8% decline is one of gold's bigger one-day movements over the past nine-plus years. But as you can see, there have been a number of days where gold rose or fell more than 5%. And it exceeded 6% on five occasions.
Here are the data for silver.
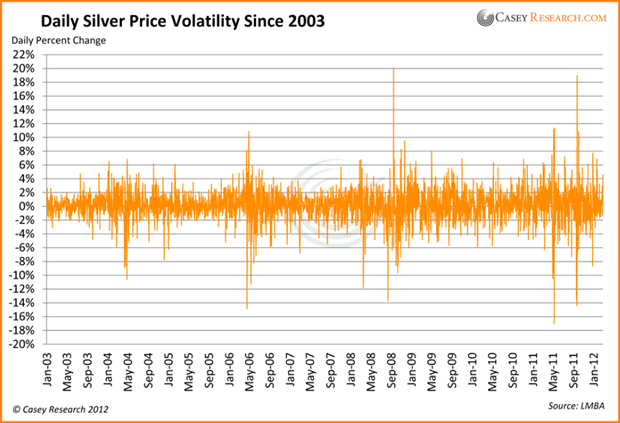
Last Wednesday's decline of 6.2% was one of the metal's bigger one-day movements. However, it's exceeded 10% on 14 occasions, 15% three times, and rose an incredible 20.06% on September 18, 2008.
You might think this kind of volatility is high - and it's true. Worse - or better, depending on how you see things - the volatility in the underlying commodity is magnified in the related company stocks. This is why Doug Casey calls mining stocks, especially the juniors, "the most volatile stocks on earth." But the thing is, metals volatility has been higher in the past, particularly during a mania.
Here's what I mean.
The following chart documents gold's daily price changes from 1976 through the end of 1980. Take a look at the jump in volatility in 1979-'80.
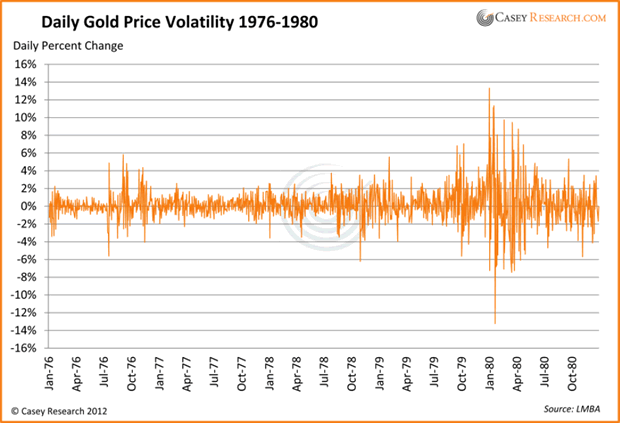
Volatility became the norm in 1979 and especially 1980. Fluctuations of 4% or more were not uncommon.
Here's the same chart for silver. The metal's volatility during the 1979-'80 period became extreme.

Daily price movements of 6% or more didn't occur once prior to 1979 - but then they became commonplace.
I wanted to take a closer look at the biggest price fluctuations during this period, so I ferreted out the largest days of volatility for each metal. For gold, I selected daily movements of greater than 5%.
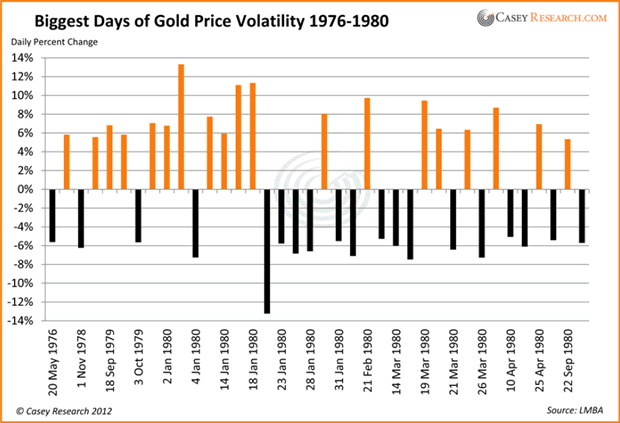
During this five-year period, gold saw fluctuations greater than 5% on 38 days (19 up, 19 down). Not surprisingly, more "up" days occurred leading up to gold's peak of January 21, 1980, and more down days came after it.
And yes, gold rose an incredible 13.3% on January 3, 1980. As it turned out, that biggest one-day rise was only 18 calendar days away from the very peak of the market. And the biggest decline of 13.2% on January 22, 1980 was the signal that the top was in.
For silver, I used one-day movements of 10% or more, all of which occurred in 1979 and 1980.
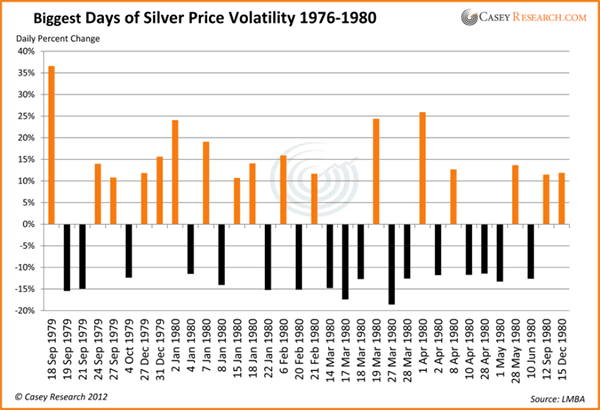
The silver price had fluctuations of 10% or more on 34 days (17 up, 17 down). They occurred over a period of only 15 months, an average of more than two per month.
And yes, silver really did rise a whopping 36.5% on September 18, 1979.
So while last Wednesday's price movements for gold and silver were big, we simply haven't seen this kind of volatility in our current bull market.
Now let's have some fun. Let's say we match the most volatile days from 1979-'80 at some point before the current bull market is over. If we use gold's biggest up day (13.3%) and biggest down day (13.2%), here's what would happen to prices from various levels. Remember, these are one-day gains and retreats:
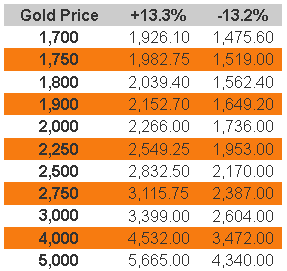
Imagine gold jumping from $1,800 to $2,039.40 in one day!
However, unless you think $1,800 is the level from which the mania starts, it's more likely we'd see a 13.3% advance (or something similar) from a higher starting point. We'd thus probably see gold jumping to $5,665 from $5,000, for example. And further, that would probably signal we're near the top.
Keep in mind that volatility worked both ways during the mania, so dropping from $4,000 to $3,472 or something similar is likely to occur as well.
Here's the same table for silver, with its biggest up day of 36.5% and down day of 18.5%.
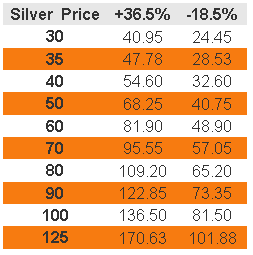
Can you imagine silver starting the day at $80 and hitting $109.20 before you go to bed that night? Something like that will probably happen at least once before this bull market is over. As with gold, though, that kind of movement is more likely to take place from a higher level, such as $100 or $125 (or higher?). And a fall like $100 to $81.50 will probably be part of the trend as well.
There are some definite conclusions we can draw from the historical picture:
-
First, if history repeats, or even rhymes, our biggest days of volatility are ahead. And they will be normal.
-
Second, big price fluctuations will be common as we enter the mania and approach the peak. In fact, when large daily movements become the norm, the historical record suggests we will be nearing the end of the cycle.
-
Third, since current volatility has thus far been lower than what was experienced during the final phase of the 1970s bull market, we are not in a bubble, nor yet in the mania phase, and nowhere near the top. Remember that the next time you hear some nincompoop spew bubble talk on CNBC.
What can an investor do with this information? Prepare yourself for bigger daily swings - in both directions. And buying on those outsized drops is probably a good strategy...
Because we now know what volatility looks like.
[Whether you're a seasoned investor or new to precious metals, you’re sure to benefit from this free gold investor's guide.]
© 2012 Copyright Casey Research - All Rights Reserved
Disclaimer: The above is a matter of opinion provided for general information purposes only and is not intended as investment advice. Information and analysis above are derived from sources and utilising methods believed to be reliable, but we cannot accept responsibility for any losses you may incur as a result of this analysis. Individuals should consult with their personal financial advisors.
© 2005-2022 http://www.MarketOracle.co.uk - The Market Oracle is a FREE Daily Financial Markets Analysis & Forecasting online publication.