


Silver Chart Analysis Indicates Why Silver Price Is Likely To Pass $150
Commodities / Gold and Silver 2012 Mar 12, 2012 - 03:48 AM GMTBy: Hubert_Moolman

 In a previous article, I wrote about the shift to measuring wealth in ounces instead of Dollars. In that same article, I expressed my opinion that I consider silver bullion to be one of the best current opportunities to increase one's gold ounces.
Here, I would like to point out some interesting signals on the long-term chart for silver.
Below, is a long term chart for silver:
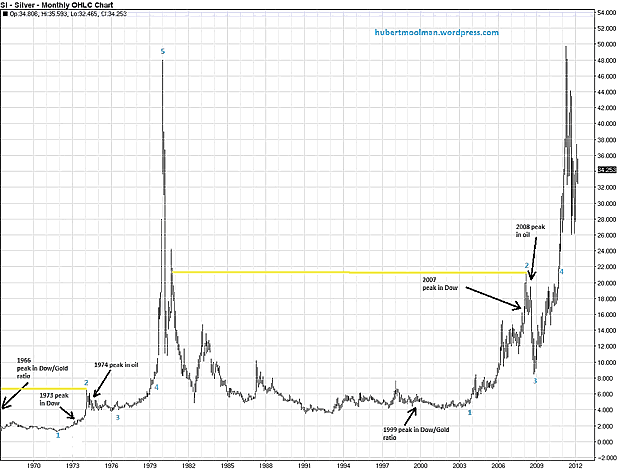
On the chart, I have highlighted two fractals (or patterns), marked 1 to 4, which appear similar. What makes these two fractals so special is the similarity of the circumstances in which they exist.
There was a significant peak in the Dow (1973 and 2007) between point 1 and 2 of both fractals. Both peaks in the Dow came about 7 years after the peak in the Dow/Gold ratio. After point 2, on both fractals, the oil price made a significant peak (1974 and 2008), about 8 years after the peak in the Dow/Gold ratio.
Thanks to this similarity in events, as well as the similarity in sequence, I was able to identify the great possibility for significantly higher silver prices, back in October of 2010. This was a very clear signal that higher silver prices were coming, and that is exactly what we got, when silver moved to $49. However, this run is not over yet. The move from $17, when silver broke out of the triangle (at point 3 of the second fractal) to $49 was just the first part of the move. In my opinion, the biggest and best part of this move is still ahead. In various previous articles on silver, I have presented a lot of evidence to support my opinion for higher silver prices over the coming years.
Based on the fractals on the chart, we could still have about two years before we could get a top like we had in 1980. That is 14 years after the Dow/Gold ratio top (beginning of 1966 to the beginning of1980 vs the end of 1999 to the end 2013).
From a price point of view, there is also an indication that this move is not over yet. If the two patterns indicated continue their similarity, it would be reasonable to expect the final top of the current pattern to higher than $150. Why? If you measure the price movement from point 1 to point 2, in the first pattern, and compare it to the price movement from point 4 to 5, in the first pattern, you will find that the movement from point 4 to 5 is at least 7.6 times larger.
Currently, the movement from 4 to the $49 in April of 2011 is only about 1.65 times larger than the movement from point 1 to 2. If it follows the first pattern, and grows at least 7.6 times greater, it will comfortably pass $150.
For more detailed analysis of gold, silver and the Dow, you are welcome to subscribe to my free or premium service.
Warm regards and God bless,
Hubert
http://hubertmoolman.wordpress.com/
You can email any comments to hubert@hgmandassociates.co.za
© 2012 Copyright Hubert Moolman - All Rights Reserved
Disclaimer: The above is a matter of opinion provided for general information purposes only and is not intended as investment advice. Information and analysis above are derived from sources and utilising methods believed to be reliable, but we cannot accept responsibility for any losses you may incur as a result of this analysis. Individuals should consult with their personal financial advisors.
© 2005-2022 http://www.MarketOracle.co.uk - The Market Oracle is a FREE Daily Financial Markets Analysis & Forecasting online publication.