


Gold and Silver Enter Period of Low Volatility and Disinterest
Commodities / Gold and Silver 2012 Apr 23, 2012 - 12:45 PM GMTBy: Jordan_Roy_Byrne

 Gold and Silver have been correcting multi-year advances. In this article we illustrate what ultimately develops as these corrections progress into consolidations. Namely, volatility declines, general interest in the market evaporates and this produces sentiment that is conducive for an important bottom. Because these are long-lasting, sustained corrections, the bottoms take time to develop. There are many fits and starts and as a result, most bottoms are not obvious until months after the fact. We provide some charts to help understand what is currently taking place and what we can expect going forward.
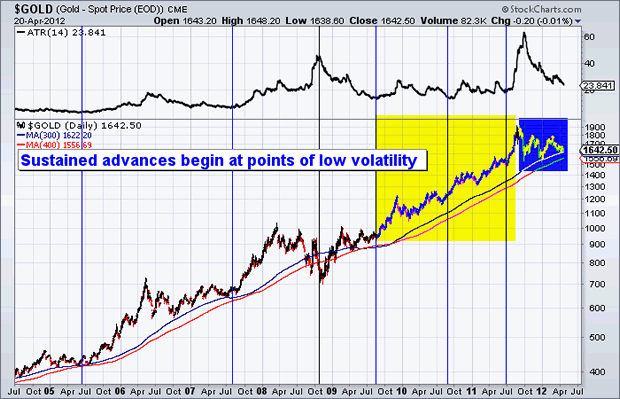
Let's start with Gold. At the top we plot the average true range (ATR) indicator which is a helpful volatility indicator of sorts. When it becomes stretched or rises too high on the chart, we can expect a reversal in trend. Note that the ATR indicator often hits a low prior to or soon after the start of an impulsive advance. This occurred with every major move with the exception being 2008 when volatility peaked during the financial crisis which sent Gold down 30%. Also, the yellow shows what was an uncorrected two year advance from $900 to $1900. This 25-month advance has been followed by an 8-month correction. Using Fibonacci retracements implies a "time" correction of 9.5 months, 12.5 months or 15.5 months. This indicates that Gold should correct (in terms of time) for at least few more months.
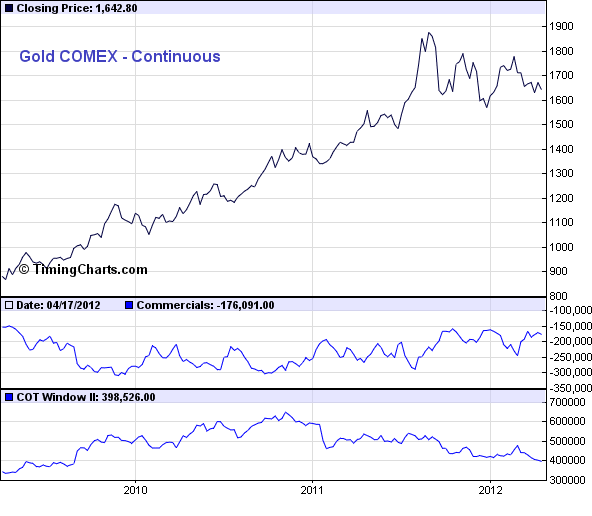
Next, we look at the commitment of traders report (COT) for Gold. The bottom rows show the commercial short positions as well as open interest. Note that the commercial short position is essentially near a three low which implies very limited speculation in the market. Moreover, open interest has declined since late 2010 and sits at a multi-year low. Traders are leaving this market en masse.
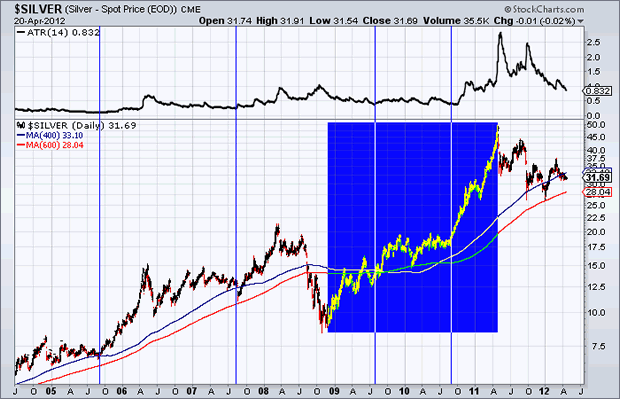
Turning to Silver, we find a similar situation. Periods of low volatility have coincided with the start of major moves in Silver. The examples are 2005, 2007, 2009 and 2010. Silver advanced from $8 to $49 in about 29 months. The market has been in a correction for 12 months. Applying Fibonacci analysis, we'd expect the correction to last 11 months, 14.5 months or 18 months. Thus, Silver could continue to consolidate for several months.
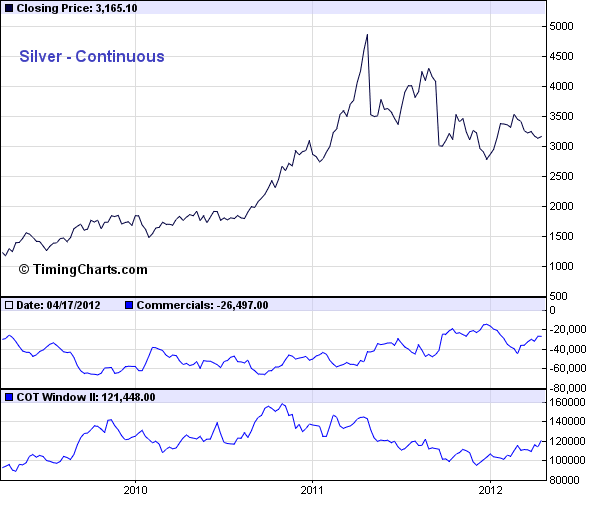
Moving to the COT, we see that commercial short positions are at 26.5K contracts which is relatively close to the 10-year low seen at the end of 2011. Open interest has begun to climb higher but it remains well below the peaks seen from 2009-2011.
Markets cycle between periods of advance, correction and consolidation as well as periods of high volatility and low volatility. In the case of Commodities, these states tend to be magnified. Advances can be sharp and fast and the same goes for corrections. Because of this, multi-month consolidations are often required to digest these big moves. When the market finds an equilibrium, which occurs at low volatility, the primary trend can reassert itself.
The point is, Gold and Silver made major moves in recent years lasting 25 months and 29 months. Such moves are not corrected and digested in a period of only a few months. As we should know by now, it takes many months. As the market gets deeper into these corrections and they become consolidations, volatility falls, bullish sentiment recedes and general interest abates. These are the conditions that precede important lows.This isn't manipulation or conspiracy. Leave that to others. This is how markets work.
It appears to me that Gold and Silver could have a few more months of consolidation before the next big move can develop. Summer is naturally a period of low volatility when these metals make lows so be patient and keep your eyes out for bargains and a potential final low in the summer. For our subscribers we are currently compiling lists of our favorite producers, small producers as well as favorite exploration companies. It will take time for the bottom to form but in a few years you will wish you were buying in 2012 rather than musing over thoughts of a rigged market, conspiracy, manipulation and anything that does nothing to help you make money.
Good Luck!
If you'd like professional guidance in this endeavour then we invite you to learn more about our premium service.
Good Luck!
Jordan Roy-Byrne, CMT
Trendsman@Trendsman.com
Subscription Service
Trendsman” is an affiliate member of the Market Technicians Association (MTA) and is enrolled in their CMT Program, which certifies professionals in the field of technical analysis. He will be taking the final exam in Spring 07. Trendsman focuses on technical analysis but analyzes fundamentals and investor psychology in tandem with the charts. He credits his success to an immense love of the markets and an insatiable thirst for knowledge and profits.
© 2005-2022 http://www.MarketOracle.co.uk - The Market Oracle is a FREE Daily Financial Markets Analysis & Forecasting online publication.