


Crude Oil - Will it go down to $40 or up to $100
Commodities / Forecasts & Technical Analysis Feb 12, 2007 - 03:19 PM GMTBy: Hans_Wagner

If you knew the answer to this one, you could make a lot of money and beat the market . So let's take a look at the issues and see what can be determined. First, demand is going to increase over time as an energy-hungry developing world needs more and more energy. Take a look at this chart from the Bank Credit Analyst showing the percentage of global oil consumption that comes from China and India. It is going from the lower left to the upper right, and only slowed during the slowdown in global growth around 2001.
Crude prices are trading near $59 as of 2/9/07, down considerably from the high of $77 it hit in 2006. Prices were down 10% over the last month. Inventories are high and parts of the northern hemisphere were having an unusually warm winter, though it is getting cold now.
OPEC has claimed they have cut their production and will likely try to cut again, as they would like to maintain prices closer to $60. The problem is that OPEC members cheat. It is one of the few reliable factors in the oil business. As a result much of the actual burden of production cuts falls on the shoulders of Saudi Arabia. They have done the work so far, but will it be enough? There is reason to think they might let oil prices drop even further in the near term. And here, I want to highlight some fascinating research by Ben Dell and his team at Bernstein Research.
Today, there are about 2.5 million barrels of spare production capacity (excluding Iraq, Nigeria, and Venezuela), with almost all of it controlled by OPEC. If OPEC actually cut production as they say they will, they could work through the high inventories and take the price back up to over $65. By the way, excess capacity is on target to rise to 4 million barrels a day in 2008, even with solid growth of 1.8% in world demand. There is a lot of new production coming online.
The problem for OPEC, however, is that most members cheat. So far Saudi Arabia has been willing to cut enough to make up for their cheating partners. But it looks like they will have to make further deep cuts in production, to 8 million barrels a day, which is below levels not seen since 1991 or the aftermath of 9/11 in 2001.
But the Saudis have said they intend to increase their production capacity to 12.5 million barrels per day by the end of the decade from 10 million barrels presently. They are spending the money to increase their capacity, and significant new capacity will come online this year and next.
Bernstein concludes: "The dilemma facing Saudi continues to grow. While cutting back incremental heavy barrels when crude prices were $75/bbl was relatively painless, the country is now facing the prospect of having to drop below 8Mbpd to keep the market balanced. At the same time, Saudi Aramco is undertaking one of the biggest investment programs over the last 20 years, as evidenced by the soaring rig count and multiple field reactivations. Of these, the AFK field is the first to come online in 3Q/4Q 2007 for 500kbpd and 1Bcfd.
"Should Saudi decide to hold back volumes to maintain prices, their proven capacity utilization would probably need to drop to 75-77%, which has historically been a threshold level. While this may sustain pricing for others it would of course lower Saudi's market share, given that few other OPEC members seem inclined to assist. Furthermore, it would continue to stimulate the oversupply in the market, hence prolonging the problem. Evidence of any countries 'cheating' on their production cuts may emerge soon with the IEA and OPEC January reports, which will be published later this month, or through February when the new quota system comes in, and will highlight the extent of the compliance within the OPEC group.
"In reality we think this is not a path that makes sense to Saudi in the long term. A sharp correction in crude prices (and especially futures prices), spurring new demand and delaying non-OPEC capacity expansions would generate short term pain but longer term gain. At the same time, the Saudis would regain control of the market while negating the Iranian threat to their leadership in the region. As always this remains something of a guessing game. However, it appears that there is only so low Saudi will go. Based on history, we are months from reaching that threshold.
"Given the weakening fundamentals of growing spare capacity, moderating demand, the high expectations for the peer group and the weakening gas market, it appears challenging to see 2007 as a year of outperformance."
Thus, the dilemma for investors. You can't really show a supply demand chart for 2007 and draw any real conclusions about price. Yes, sometime next decade demand may indeed start to bump up against supply, but the price of oil today is as much political as it is supply and demand.
If Saudi Arabia decides that the rest of OPEC is not doing its fair share of cuts, it could simply allow the price of oil to drop to $40 for a short period of time, causing some real pain. The fact that it would hurt Iran as much or more is probably not lost in the inner chambers of Riyadh. At $40 oil, Iran does not have the spare cash it needs, let alone has promised. It could make the current regime a lot more shaky.
A drastic drop in oil prices would let everyone in OPEC know they need to get with the program. Also, it would stop a lot of new oil projects around the world and stimulate demand (as lower prices always do). To get all of that to happen might be worth a little fall in cash flow for a few months or quarters. And when their new capacity comes online as world demand grows, the rest of OPEC goes along with production quotas to maintain higher prices. As world demand grows, and prices rise, Saudi pockets even more vast sums of money. And they let Iran know who holds the real power.
Thus, there is no "normal" price for oil. It is still what a few men with willpower sitting around a table decide it is. Ultimately, OPEC will lose that power, as world demand grows past supply, but that is not this decade. At that point, the market will set price.
Of course, the price of oil could shoot up with a collapse in Nigeria, as rebels are becoming increasingly active. Or Iraq or any number of unstable regions that produce oil could have problems.
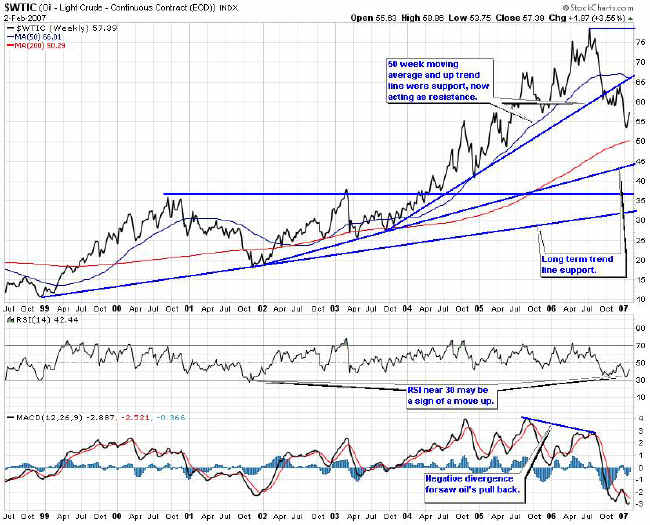
So what does a technical view of oil show us? The chart below is a multi year picture of oil showing long term up trends beginning in 1999 and 2002 that have not been broken. The steeper trend that began in the later half of 2003 was broken late in 2006. It now acts as resistance on any move up. Of particular interest is the 50 week moving average that has acted as support on up trends and resistance on moves down. The 200 week moving average could also act as support in the 50 area.
While it has not finished forming, we may be looking at a large ascending triangle for oil with either of the two longer up trends acting as support. If this is the case then oil will move up and down for a while between 77 and 45 area (assuming the up trend that begin in 2002 holds).
As investors, oil is an important economic factor. Given this analysis, it looks like oil prices are not likely to go down to $40 and stay there for long. They also are not likely to go to $100 any time soon, baring any major disruption in the supply. This framework give us a way to find oil related opportunities, buying when it finds support and selling at resistance, while keeping a watchful eye on the political and economic factors that affect oil. Our Stock Research has identified a couple of energy companies that offer good value. We will likely come back to this idea at key opportune times.
Finally, it makes one think that if the major economies of the world could reduce their dependence on oil, how it might change some of the current geopolitical situation.
by Hans Wagner
tradingonlinemarkets.com
My Name is Hans Wagner and as a long time investor, I was fortunate to retire at 55. I believe you can employ simple investment principles to find and evaluate companies before committing one's hard earned money. Recently, after my children and their friends graduated from college, I found my self helping them to learn about the stock market and investing in stocks. As a result I created a website that provides a growing set of information on many investing topics along with sample portfolios that consistently beat the market at http://www.tradingonlinemarkets.com/
© 2005-2022 http://www.MarketOracle.co.uk - The Market Oracle is a FREE Daily Financial Markets Analysis & Forecasting online publication.