


Gold, Forex and Stocks Intermarket Analysis and Trading Chart Setups
Stock-Markets / Financial Markets 2012 May 15, 2012 - 04:43 PM GMTBy: Capital3X

 We would first like to give a quick update on the state of fundamental data and policitcal situation before we dive deeper into technical charts and forex setups.
French Election
With 51.7% of the vote, the socialist Hollande has narrowly won the French presidential election. At the election to the National Assembly due to take place in June, his side should win the majority needed to govern. However, Hollande’s victory makes the battle to contain the sovereign debt crisis even more complex. Hollande largely ignores France’s economic problems; the French economy is likely to drift further southwards. It will also make it even harder for France and Germany to agree a common line. The ECB will continue to de facto finance the peripheral countries by printing money for longer than many had feared.
This pressure to print money is the main reason why we expect a significantly lower EUR-USD exchange rate in the medium term. FX markets were right to sent EUR-USD lower overnight.
US trade deficit
The US trade deficit widened to $51.8bn in March from $45.4bn (originally reported as $46bn), in line with our forecast ($52bn) but above the consensus estimate ($50.0bn). The increase is merely a reversal of the drop in February. Exports gained 2.9% while imports were up 5.2%. When the trade deficit slumped in February on lower imports, we wrote in our commentary that this was probably related to distortions following the Chinese Lunar New Year. Consequently, we forecast a snap-back in March. Our view was based on figures from US ports which showed that containers landed at ports on the west coast (where imports form China would arrive) declined significantly in February while there was virtually no change at the ports on the east coast. As expected, business rebounded on the west coast in March (chart). Today’s trade data corroborate our story. The deficit in the real balance of goods widened from $44.1bn in February to $48.9bn in March. More importantly, however, the deficit should be broadly in line with the BEA’s assumption it had pencilled in when estimating real GDP in the first quarter. While this in itself would not argue for a revision of the initial estimate of 2.2% growth, reports on construction spending and inventories disappointed, however, suggesting a downward revision to 1.8%.
Key Highlights till now:
Greece fails to form a stable governing coalition over the weekend. Markets await any commentary from party heads as they are set to meet at 1730BST.
The PBOC have cut their RRR to 20% from 20.5% for large financial institutions in an effort to inject CNY 400bln into the national economy.
German Chancellor Merkel’s CDU party is defeated in regional parliamentary elections by the SPD.
Flight to quality observed across the markets, with equities seen sharply lower and fixed income securities making gains throughout the session as risk-aversion is the theme of the day so far.
Both Spain and Italy have managed to sell to the top of the indicative range in their respective auctions, however both countries saw an increase in borrowing costs, with the Italian yield hitting its highest level since January in their only on-the-run line. (Sources)
German chancellor Merkel‟s centre-right CDU suffered a bruising defeat on Sunday night in the election of a new parliament in North Rhine-Westphalia. (FT-More) According to the predictions from the ARD, results show the SPD got 39%, the CDU plunged to 26% and the Greens remain stable at 12%. (at the last NRW elections: SPD: 34.6%, CDU: 34.5%, Greens: 12.1%). (Die Welt)
The German finance minister said that Greece would receive a further aid program from the EFSF if it exited the Euro. He added that he remains confident that the fiscal pact will be approved in the German parliament before the summer break. (Spiegel/Welt am Sonntag).
A few Charts and setups before we round it off with charts from our staple indicators Falconfx and Gladiator. If you have still not got into the exclusive club, you can do so here before we raise prices for these super indicators. Indicator Membership.
Gold charts
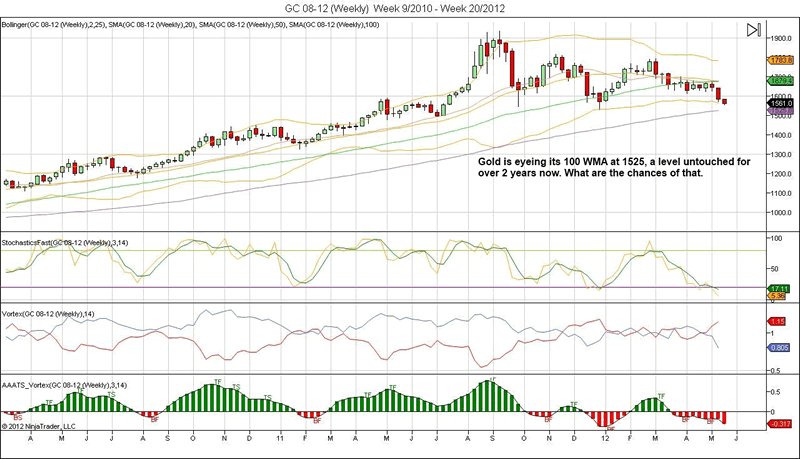
The weekly has its 100 WMA coming in at 1525. This is the first time in 24 months that we have gold prices coming in striking distance of this level. To be fair, if this price goes on the week closing, Gold uptrend is done and dusted for some time to come.
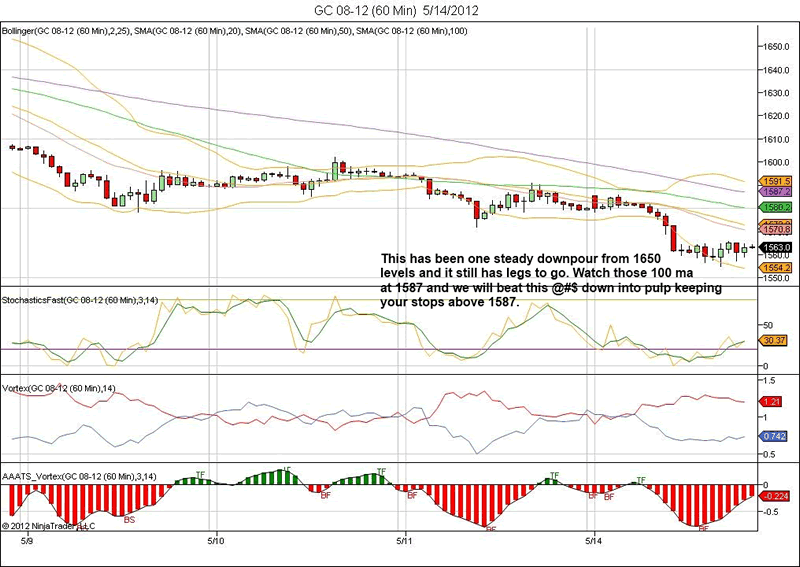
The Gold hourly charts has some retrace value to 1587 which is the 100 ma which has capped any form of rally. This can be shorted non stop till the time we get bored off it.
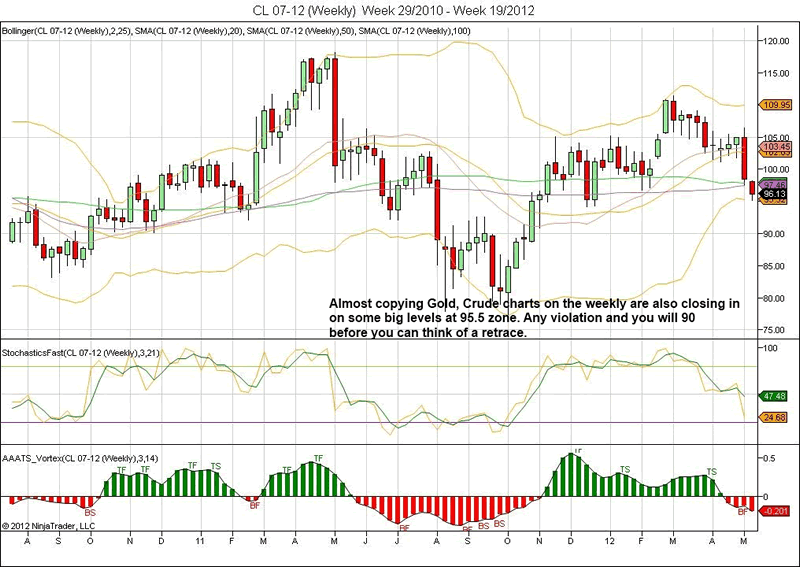
The Oil weekly looks bearish with strIking distance of 100 WMa.
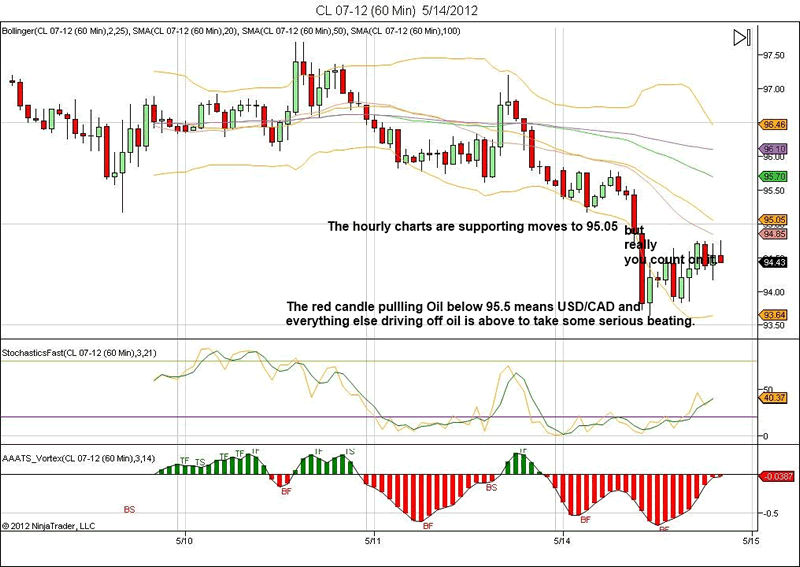
The Oil hourly looks even more bearish as it pierces 95.5 which was key to supporting any retrace back to 98 levels. Now we are targeting 90.5 levels but as usual your stops have to be above the previous breakdown level at 95.5.
Forex Setups
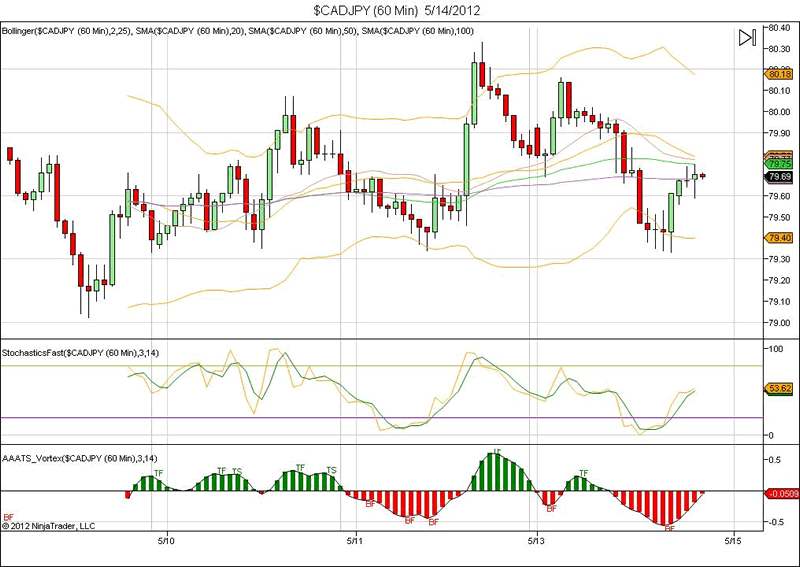
CAD/JPY hourly has multiple resistance lines flowing in till 80. This should hold the retrace before it takes the larger trend down.
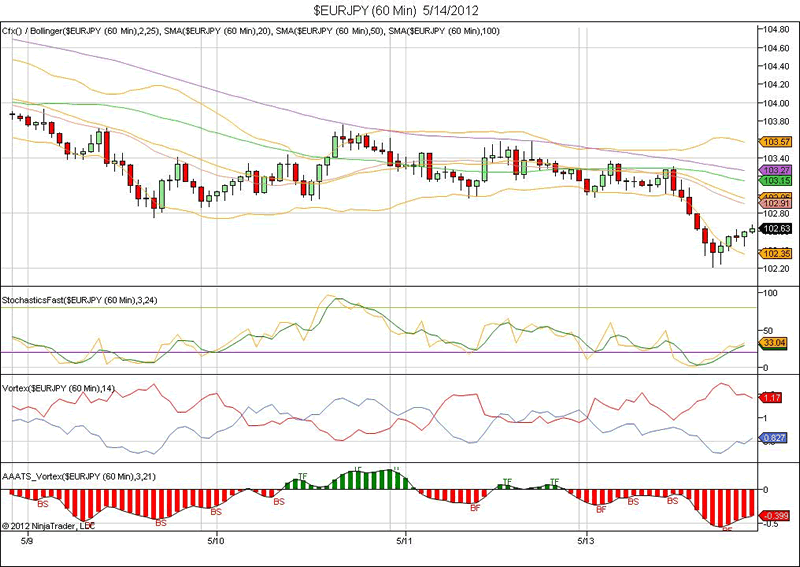
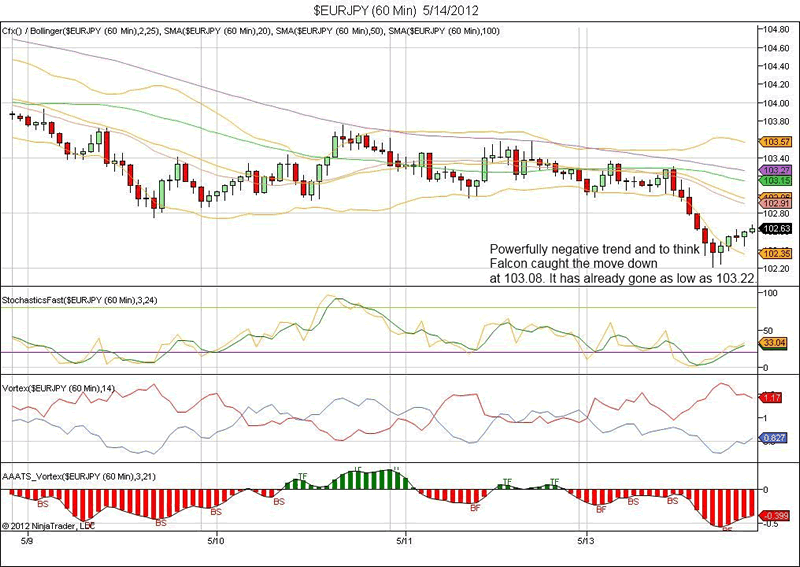
The EJ hourly has already touched 102.2. It violated the inside day setup on which we had high hopes of retrace but the thing with inside days is that they are two way swords. they can resolve either ways and it will be rewarding both ways.
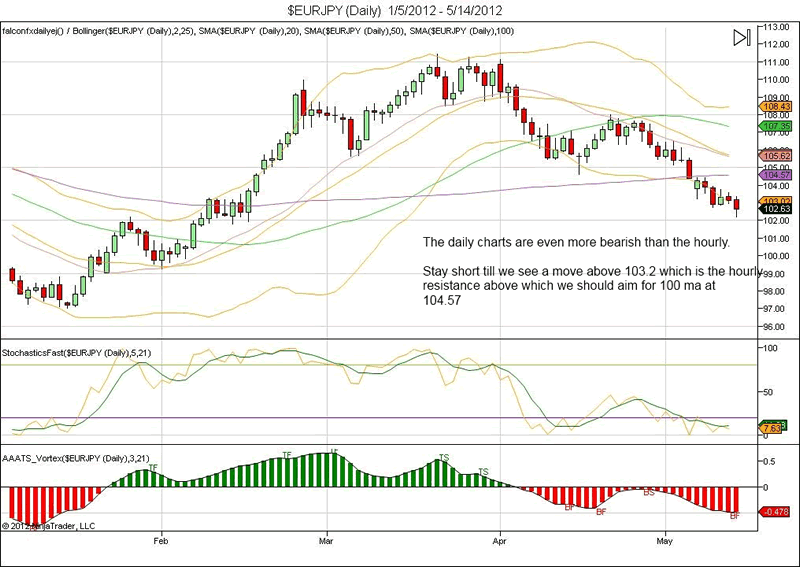
On the daily charts, 104.56 is the 100 ma which should technically be tested at some point. The level to trigger that move could be a break of the hourly resistance at 103.2. So get your helmets and hold tight as the move will not be straight line but wrought with mines all around as you hear all kinds of views and opinions. Mind no one and keep eyes focused on the price.
ES Setups
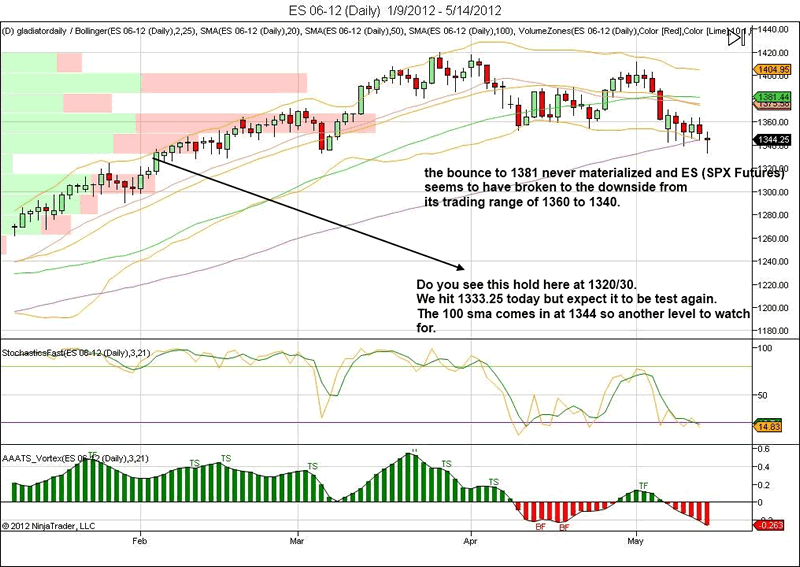
The ES daily is at the most important level in its downtrend. It is in striking distance of the level which we noted when ES was at 1380. We had said that the next stop is 1330 which is the huge volume hole. This will induce fireworks so be ready for it as the bears pummel it down and bulls have to defend it else we are heading much much lower (1279?).
On the hourly, the resistance lines come in till 1350 which is where the 100 ma comes in while the upper BB comes in at 1357.
Bond Market Internals
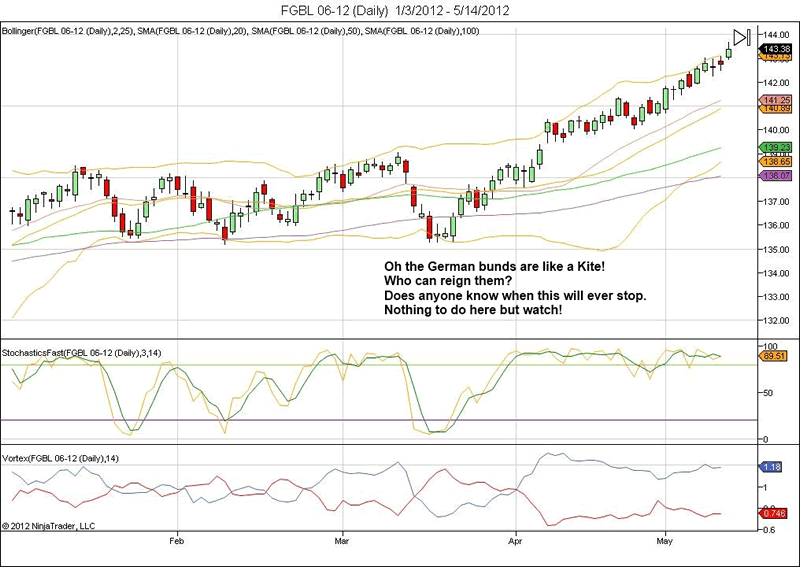
The German bunds are at all time highs. Is this the 10 time am writing that in the last 20 posts? Well there is nothing to do here as there is nothing to show in the charts which means even the slightest of fault lines. What we need to look at is what does it mean for other assets like DAX and SPX.
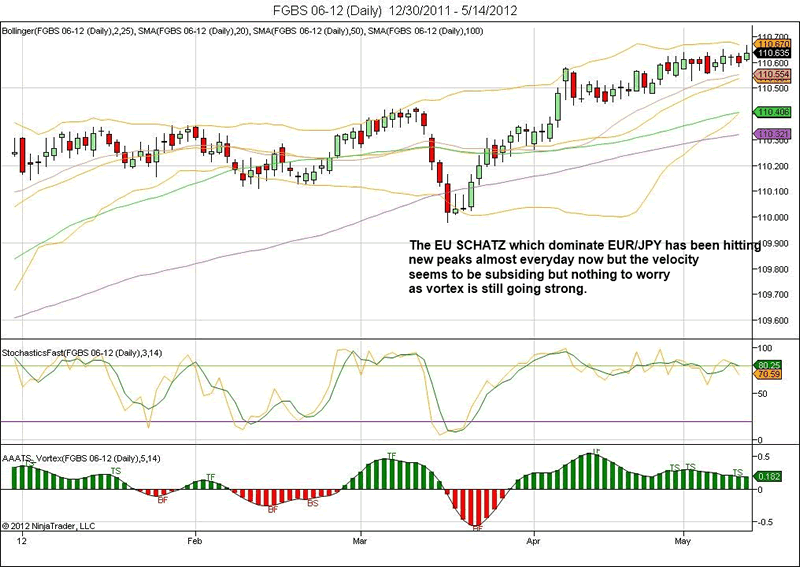
The EU SCHATZ (2year) bonds are what determine the price of EUR/JPY (in theory but in practice they can swing around the mean fair price). The EU SCHATZ is hitting daily peaks but a retrace back to support line at mid BB at 100.55 cnanot be ruled out. If that does happen, mind you the above discussed trade on EUR/JPY to 104.57 will also materialize. Keep eyes on this one.
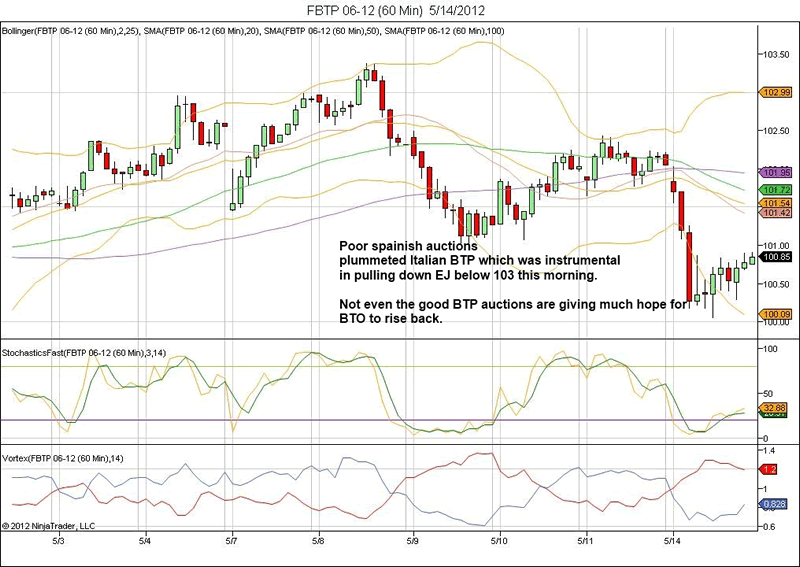
The Italian BTP had a complete nervous breakdown this EU morning as poor Spainish auctions almost gave it a heart attack but did recover after its own auction went strong. But even then BTP looks weak and barring a weak bounce to 101.42, we are headed sub 100.
Finally, charts and setups from Falconfx and Gladiator
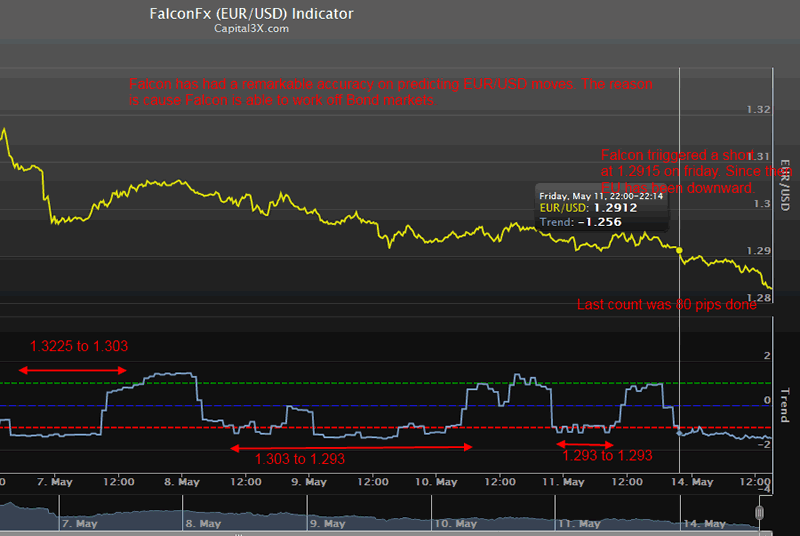
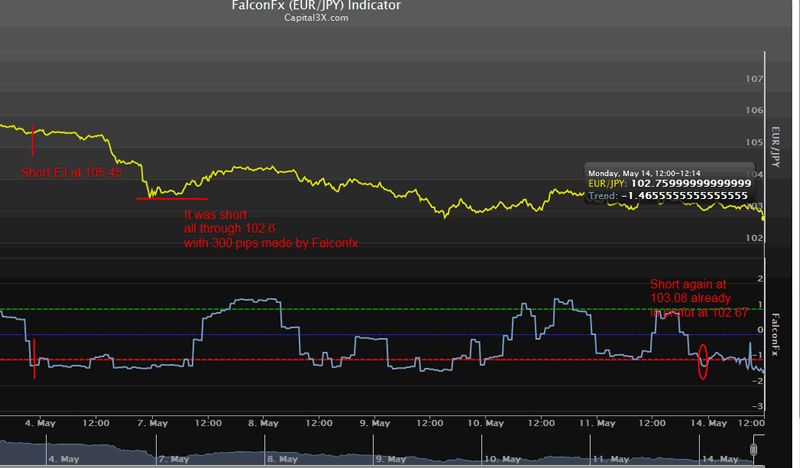
The Falconfx forex indicator is available for EUR/USD, EUR/JPY and USD/CAD. These are proprietary forex indicators from the bond markets. Forex moves are first derived off bond market yields and hence this is the first truly predictive forex trend indicator released to retail forex.
The Gladiator is a one of its kind risk indicator derived from the bond markets (working from UST2 Year, UST 10 Year, EU SCHATZ, EU Bunds). The indicator is plotted as indicator to SPX futures.
The Indicator links are provided here:
1. Falconfx EUR/USD
2. Falconfx EUR/JPY
3. Falconfx USD/CAD
4. Gladiator ES
All Indicator subs get access to the Live Trade room. Please do visit the The Cheat Sheet for Indicators:http://capital3x.com/the-code/cheat-sheet-gladiator-and-falcon/
If you are not a member with us: There are two levels of membership
- Capital3x membership which comes with all the benefits of Capital3x FX portfolio and premium analysis.
- Capital3x Membership with MNI news bulletsThere is a combined package where you can get both Capital3x and MNI forex real time news bullets. You can explore membership to that via this link:
Kate Capital3x.com Kate, trading experience with PIMCO, now manage capital3x.com. Check performance before you subscribe.
© 2012 Copyright Capital3X - All Rights Reserved
Disclaimer: The above is a matter of opinion provided for general information purposes only and is not intended as investment advice. Information and analysis above are derived from sources and utilising methods believed to be reliable, but we cannot accept responsibility for any losses you may incur as a result of this analysis. Individuals should consult with their personal financial advisors.
© 2005-2022 http://www.MarketOracle.co.uk - The Market Oracle is a FREE Daily Financial Markets Analysis & Forecasting online publication.