


Stock Market Dow Theory Update
Stock-Markets / Dow Theory Jun 13, 2012 - 12:34 PM GMTBy: Tim_Wood

As a result, of the decline below the April 10th lows, many articles on Dow theory surfaced saying that a so-called Dow theory sell signal was triggered. This is not exactly correct. In fact, most articles written on Dow theory are erroneous. Reason being, most of the people writing these articles have not read the original writings by Charles H. Dow, William Peter Hamilton and particularly Robert Rhea. As a result, they simply do not understand Dow theory.
The problem with Dow theory is not that it's so difficult to understand. It's that so few have actually read and studied the original material and therefore, it is utterly impossible to understand what one hasn't read. Yet, we have so many people writing about Dow theory when they really aren't qualified to do so. As a result, 99% of what you see on this subject is erroneous. It is for this reason that there is so much misinformation, misunderstandings and confusion on the topic. Richard Russell is responsible for helping me obtain my copy of the original Dow theory writings and it is for this reason that I have been able to acquire the knowledge of Dow theory that I have. The current Dow theory chart can be found below.
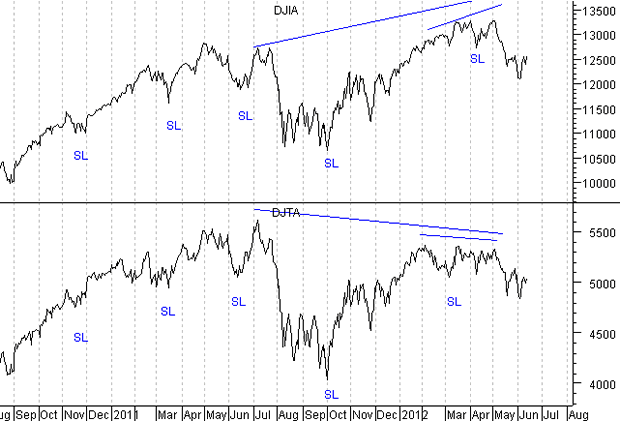
With Dow theory, a primary trend change requires a close by both averages above or below a previous secondary high or low point. It is these primary trend changes that are mistakenly referred to as buy and sell signals. But, the most common mistake made is correctly identifying the secondary high and low points. Also according to Dow theory, once a trend change occurs, that trend change remains intact until it is reversed by an opposing move above or below another secondary high or low point. Fact is, the violation of the June 2011 secondary low point, which occurred last August, triggered a Bearish Primary Trend change. Fact is, that trend change was never reversed and has remained intact all along. Reason being, from the October 2011 secondary low points, the market advanced into their secondary high points, which occurred in February on the Transports and in May on the Industrials. Because the Industrials bettered their July secondary high point and the Transports did not, the previously established bearish primary trend change that occurred last August has remained intact all along. Also, because the Industrials bettered their previous secondary high point and the Transports did not, a non-confirmation was formed in association with this advance. The fact that one average moved to a higher high following a Dow theory bearish trend change while the other one did not is not uncommon. In fact, this happened following the 2000 and the 2007 tops and as was the case then, most were confused by the price action. Also, in other cases, trend changes and non-confirmations have been corrected. It is for this reason that my statistical based quantification work is so important as it gives us an additional dimension and greater insight than Dow theory alone.
Let me explain. I know from my cycles work, which has absolutely nothing directly to do directly with Dow theory, that intermediate-term cycle high and low points coincide with secondary high and low points in accordance with Dow theory. In other words, history has shown that they are one and the same move regardless of what label we put on them. However, the cyclical work allows us to develop statistical based quantifications that Dow theory alone does not offer. As an example, in the wake of the bearish primary trend change that occurred in August and the continued decline into the October low, it was because of the cyclical based statistical quantifications and DNA Markers that I was able to make the call last year for a move above the May 2011 high. It was also this same statistical based work that allowed me to correctly identify the 2000 top, the 2007 top, the 2009 low and even the 2008 top in commodities to mention a few. In fact, this statistical based work even told us that we should expect the low in October last year in the wake of the bearish sentiment and bearish primary trend change. Cyclically, we know that the last intermediate-term cycle lows occurred in March on the Transports and in April on the Industrials. As a result, this confirms that the break below these levels re-triggered an orthodox Dow theory trend change in the wake of the previously established bearish primary trend change from last August, which again, has been in force all along. Also, I want to stress again that it is because the last secondary high points, which happens to have been the July high, was not bettered by both averages, that the Primary Trend change from last August has remained intact all along. Now, the key is the statistical based quantification work.
In addition to the longer-term non-confirmation that occurred as a result of the Transports failing to better their July high, we also have a shorter term non-confirmation in place as well. As the averages advanced out of the October 2009 secondary low point, they moved into their last joint high in February. From that point, the Industrials continued higher while the Transports began to lag. As a result, another shorter-term non-confirmation was formed. Therefore, we now have a non-confirmation at two levels. With this all said, a Dow theory trend change is only part of the equation, because as was proven following the bearish trend change from last August, as well as has been seen in other cases, price can move higher even in the back drop of a bearish trend change. The key now is the appearance of my statistical based DNA markers and the associated cyclical structure. When I say DNA Markers I'm simply referring to a check list of common denominators seen at a given turn point of a given degree. The developments surrounding these common denominators and our current expectations are discussed in detail in my monthly research letters and short-term updates. Bottom line, it is now these structural developments and the DNA Markers that are key, as we move forward in the wake of this Dow theory non-confirmation and the re-triggering of a bearish primary trend change.
I have begun doing free market commentary that is available at www.cyclesman.info/Articles.htm The specifics on Dow theory, my statistics, model expectations, and timing are available through a subscription to Cycles News & Views and the short-term updates. I have gone back to the inception of the Dow Jones Industrial Average in 1896 and identified the common traits associated with all major market tops. Thus, I know with a high degree of probability what this bear market rally top will look like and how to identify it. These details are covered in the monthly research letters as it unfolds. I also provide important turn point analysis using the unique Cycle Turn Indicator on the stock market, the dollar, bonds, gold, silver, oil, gasoline, the XAU and more. A subscription includes access to the monthly issues of Cycles News & Views covering the Dow theory, and very detailed statistical-based analysis plus updates 3 times a week.
By Tim Wood
Cyclesman.com
© 2011 Cycles News & Views; All Rights Reserved
Tim Wood specialises in Dow Theory and Cycles Analysis - Should you be interested in analysis that provides intermediate-term turn points utilizing the Cycle Turn Indicator as well as coverage on the Dow theory, other price quantification methods and all the statistical data surrounding the 4-year cycle, then please visit www.cyclesman.com for more details. A subscription includes access to the monthly issues of Cycles News & Views covering the stock market, the dollar, bonds and gold. I also cover other areas of interest at important turn points such as gasoline, oil, silver, the XAU and recently I have even covered corn. I also provide updates 3 times a week plus additional weekend updates on the Cycle Turn Indicator on most all areas of concern. I also give specific expectations for turn points of the short, intermediate and longer-term cycles based on historical quantification.
Tim Wood Archive |
© 2005-2022 http://www.MarketOracle.co.uk - The Market Oracle is a FREE Daily Financial Markets Analysis & Forecasting online publication.