


Stock Market Giving Major Correction Signs
Stock-Markets / Stock Markets 2012 Jul 04, 2012 - 11:13 AM GMTBy: David_Banister

 The SP 500 has rallied up into the 1375/77 pivot areas as I had outlined to my subscribers about 10 days ago on the weekend update as possible highs for C wave up from the 1267 SP 500 lows of June. Many forecasters are now getting very bullish, but I continue to see divergences with The Elliott Wave counts and other indicators that are giving me some short term concerns, and then we can determine if these are long term issues still for the markets.
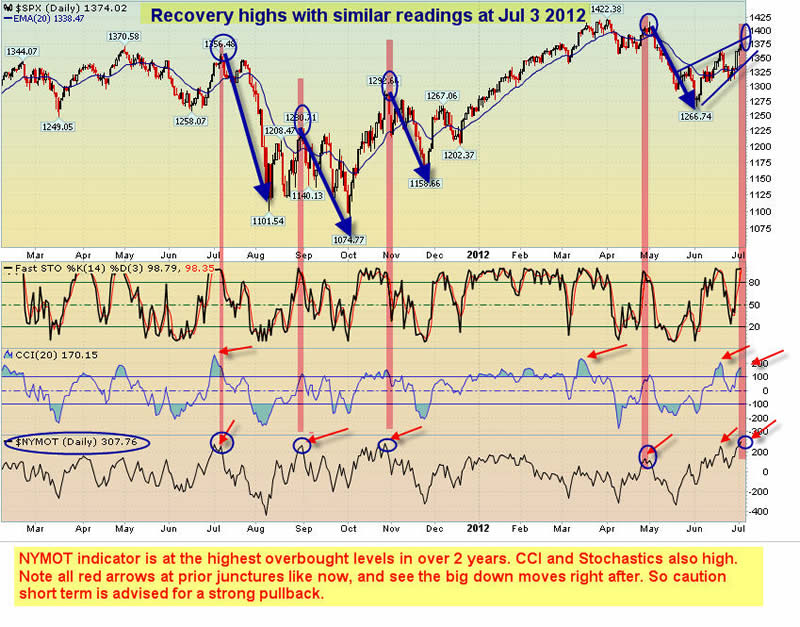
Today’s Independence Day update shows a new chart pointing out prior “Recovery rally highs” since the May 2011 1370 highs on the SP 500. In each case, a major market correction unfolded when we had the NYMOT indicators at these levels along with Stochastics, CCI, and other Fibonacci indicators I incorporate at various times. Currently, we have the NYMOT indicators at a reading of 307. To understand this in context, its the highest reading in the past two years. Higher than the 1292 SP 500 rally high in October 2011 (From 1074) and higher than any other rally high in the past 24 months.
Adding to that, we have the Stochatics indicators at extreme short term highs and the CCI index is nearing the levels it read at the recent 1363 pivot highs. Finally, further puzzle pieces continue to show divergences in the Elliott Wave patterns. The rally from 1267-the current 1375 levels can’t be interpreted in my opinion as a 5 wave rally (which would be bullish), instead its an overlapping 3 wave rally in my views., or a double zig zag. These types of rallies are corrective rallies against a prevailing trend, which was down in to early June.
The rally to 1375 areas is actually in the zone I discussed a few weeks ago, and still in the 1386 or lower Fibonacci zone I’ve outlined as a C wave target for an ABC rally from 1267 June 2012 lows. My work still gives a model of 1422-1267 as 5 waves down, and 1267-current as a zig zag corrective pattern up. The market will soon tip it’s hand I think after this holiday week is over and we see a bit more volume return next week.
With all of this said, it is difficult to be too bearish given the 52 week highs in many blue chip stocks as well as the strong advance-decline lines and recovery in some of the tech stocks of late. When you get a lot of conflicting signals like this, I try to fall back on a variety of indicators and clues to help clear up the clouds of the market.
In conclusion, near term I will be very surprised if at a minimum we do not have significant pullback in the market next week. The rally could sneak a bit higher during this holiday light volume week, so lets look to next week for volumes to return and tell the tale. Taking some gains off the table in the coming 1-2 trading days is probably not a bad move.
If you’d like to receive these types of regular updates during the week covering Gold, Silver, and SP 500 and more, check us out for a coupon or free weekly update at www.MarketTrendForecast.com
Dave Banister
CIO-Founder
Active Trading Partners, LLC
www.ActiveTradingPartners.com
TheMarketTrendForecast.com
Dave Banister is the Chief Investment Strategist and commentator for ActiveTradingPartners.com. David has written numerous market forecast articles on various sites (SafeHaven.Com, 321Gold.com, Gold-Eagle.com, TheStreet.Com etc. ) that have proven to be extremely accurate at major junctures.
© 2012 Copyright Dave Banister- All Rights Reserved
Disclaimer: The above is a matter of opinion provided for general information purposes only and is not intended as investment advice. Information and analysis above are derived from sources and utilising methods believed to be reliable, but we cannot accept responsibility for any losses you may incur as a result of this analysis. Individuals should consult with their personal financial advisor.
© 2005-2022 http://www.MarketOracle.co.uk - The Market Oracle is a FREE Daily Financial Markets Analysis & Forecasting online publication.