


U.S. Stock Market Drop Like a Rock Scenerio
InvestorEducation / Elliott Wave Theory Jul 28, 2012 - 10:39 AM GMTBy: EWI

 Financial markets always have and always will pose two basic questions that investors seek to answer:
- What's the direction of the main trend?
- How far will it go?
Systematic approaches to these questions commonly belong to either fundamental or technical analysis. Let's consider each one briefly.
Fundamental analysis studies how a market behaves in response to external influences such as earnings, sales, competitive outlook, economic outlook and the like.
Technical analysis studies a market's internal behavior -- mainly price, but also internal measures like volume.
Elliott wave analysis is a branch of technical analysis, specifically pattern recognition.
In the 1930s, Ralph Nelson Elliott discovered that stock market prices trend and reverse in recognizable patterns...Elliott isolated five such patterns, or "waves," that recur in market price data.
Elliott Wave Principle: Key to Market Behavior (p. 19)
In a five-wave progression, the third wave is the most powerful.
Third waves unfold in bull and bear markets alike. Elliott Wave Principle (p. 80) describes a third wave in a bull market:
Third waves are wonders to behold. They are strong and broad, and the trend at this point is unmistakable...Third waves usually generate the greatest volume and price movement and are most often the extended wave in a series. It follows, of course, that the third wave of a third wave, and so on, will be the most volatile point of strength in any wave sequence.
Third waves can be more powerful during market declines because fear is a stronger emotion than greed.
Look at the third wave on this S&P 500 chart which published in the January 2009 Elliott Wave Financial Forecast. Notice that prices dropped like a rock, plunging well over 600 points in less than a year. (The third wave starts where the chart shows (2) and ends at (3)):
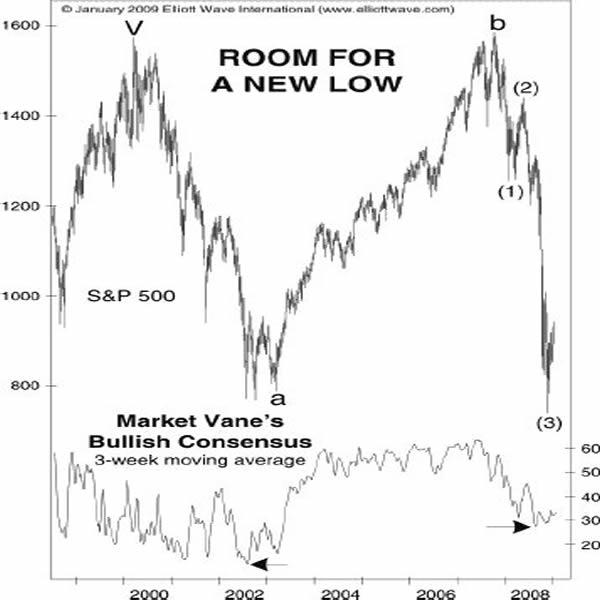
You can see on the chart that the S&P 500 had rebounded after the third wave had bottomed. Even so, the chart's title states that there was "Room for a New Low." Indeed, after the rebound which was wave (4), wave (5) took prices to a March 6, 2009 intraday low of 666.79.
How about now?
That depends on who you ask.
On July 10, CNBC reported on the sentiment of a chief market strategist of a capital management firm:
Ever the optimist, he is holding to his market call this year for the S&P 500 to hit 1,500.
A principal of a financial advisory firm and guest columnist for Marketwatch wrote a July 10 article titled "Stock charts don't lie: the trend is up." The article says:
Shares continue their winning ways, technically. The averages show a stair-step series of higher highs and higher lows, the definition of an uptrend.
By contrast, the latest Financial Forecast flat out says:
The stock market is nowhere near a lasting low.
Why does the Financial Forecast differ from the two opinions above?
Because Elliott analysts know that during a market downtrend, second waves can convince investors that the rally is a new bull market.
That can be a financially dangerous mind-set.
Optimism precedes third waves lower. Then, seemingly out of nowhere, a third wave can commence with unrelenting violence and speed.
In the chart above, you saw the optimism-driven rebound just before prices plunged.
Do not expect the financial media to provide you with advance warning of a third wave. The crowd is almost always on the wrong side of the market. Third waves arrive unannounced.
|
Learn How to Spot Third Waves and More - FREE!The Elliott Wave Crash Course is a series of three FREE videos that demolishes the widely held notion that news drives the markets. Each video will provide a basis for using Elliott wave analysis in your own trading and investing decisions. You'll get the Why, What, and How of Elliott Wave Analysis:
|

This article was syndicated by Elliott Wave International and was originally published under the headline The Drop Like a Rock Scenario for U.S. Markets. EWI is the world's largest market forecasting firm. Its staff of full-time analysts led by Chartered Market Technician Robert Prechter provides 24-hour-a-day market analysis to institutional and private investors around the world.
About the Publisher, Elliott Wave International
Founded in 1979 by Robert R. Prechter Jr., Elliott Wave International (EWI) is the world's largest market forecasting firm. Its staff of full-time analysts provides 24-hour-a-day market analysis to institutional and private investors around the world.
© 2005-2022 http://www.MarketOracle.co.uk - The Market Oracle is a FREE Daily Financial Markets Analysis & Forecasting online publication.