


Gold at a Cross Road: What to look For
Commodities / Gold and Silver 2012 Oct 14, 2012 - 11:54 AM GMTBy: GoldSilverWorlds

Scott Pluschau writes: I have been looking to put on a swing or position trade to the long side in Gold for the past five weeks but have been unable to do so. There hasn’t been a pattern that I felt offered me a favorable trade location in regards to risk and reward in order to justify that entry. The bottom line is preservation of capital in speculating.
There are two conflicting patterns in gold right now:
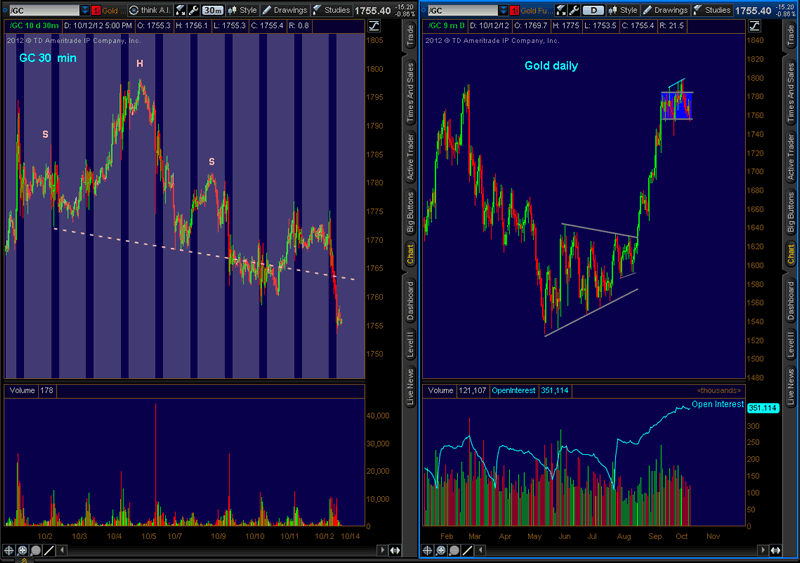
The 30 minute chart has a Bearish “Head and Shoulders” pattern that developed over the past ten days and can be seen on the left hand side chart below. A failed pattern is a very strong signal. The right shoulder at $1,782 needs to get taken out prior to the “Measured Rule” target being reached in order for this to happen. The measured rule is taking the distance from the top of the “head” to the “neckline” and adding onto the breakdown point. A target for the Bears is approximately $1,740 on this near term head and shoulders pattern.
In the longer term timeframe, gold is now at support of a “Balance Area” which is similar to a “Rectangle” pattern on the daily chart. Rectangles can be “reversal” or “continuation” patterns but the greatest odds are to trade with the prior trend. Some of the most favorable trade locations can be found near support of a rectangle (around $1,750), or on a breakout to the upside of a rectangle (around $1,800) into a new trend. Volume has been somewhat subdued on the selloff and this is exactly what a Bull wants to see on a pullback to support. The Bulls would also want to see an increase in volume on the breakout above $1,800.
Longer term time frame traders ultimately determine price direction, so I believe it is wise to trade on the right side of that order flow. These Bullish traders should believe there is “value” here at $1,750. It is for this reason I have no desire to be short gold at this time.
What am I looking for in order to get long?
While gold is at the lower extreme of the “rectangle” I am looking for a bullish reversal pattern on the 30 minute chart or a consolidation pattern and breakout to the upside on the 30 minute chart in order to enter a trade to the long side. This type of trade would offer the risk of the smaller degree timeframe with an extreme multiple of reward from the longer term timeframe. Any confirmation of that order flow would begin to put the screws to the shorts in my experience.
Open Interest in the latest Commitments of Traders Report increased by 3,451 contracts. There is plenty of juice to be squeezed out of this market. Open Interest has been steadily climbing in the daily timeframe which can be seen on the lower study of the daily chart, see right hand side below. Likewise there is also plenty of long liquidation potential too.
This is why I believe it is best for my trade plan to wait for the right pattern to develop that will offer me increasing probabilities for a positive outcome. I look forward to intuitively identifying these patterns next week.
Subscribe now to my swing trading premium service.
Source - http://goldsilverworlds.com/gold-silver-price-news/gold-is-at-a-cross-road-what-to-look-for/
© 2012 Copyright goldsilverworlds - All Rights Reserved Disclaimer: The above is a matter of opinion provided for general information purposes only and is not intended as investment advice. Information and analysis above are derived from sources and utilising methods believed to be reliable, but we cannot accept responsibility for any losses you may incur as a result of this analysis. Individuals should consult with their personal financial advisors.
© 2005-2022 http://www.MarketOracle.co.uk - The Market Oracle is a FREE Daily Financial Markets Analysis & Forecasting online publication.