


Investment decisions based on the Business Cycle and Sector Rotation
InvestorEducation / Investing Feb 20, 2007 - 10:23 AM GMTBy: Hans_Wagner
 The business cycle is a long-term pattern of changes in Gross Domestic Product (GDP) that follows four stages: expansion, prosperity, contraction, and recession. After a recessionary phase, the expansionary phase can start again. The phases of the business cycle are characterized by changing employment, industrial productivity, and interest rates. Some economists believe that stock price trends precede business cycle stages. As a result the economic cycle provides the strategic framework for economic activity and investing. The business cycle affects employees, employers and investors. For example:
-
The economy is strong; people are employed and making money. Demand for goods -- food, consumer appliances, electronics, and services -- increases to the point where it outstrips supply. This demand fuels a rise in prices, or inflation.
-
As prices increase, people ask for higher wages. Higher employment costs translate into higher prices for goods, fueling an upward spiral effect.
-
When prices get too high, consumers decide goods are too expensive and demand decreases. When demand decreases, companies lay off workers because they don't need to make as many goods or provide as much service.
-
Decreasing demand fuels declining prices, which means the economy is in a recession.
-
Lower prices spur demand. As demand picks up, people begin buying again, fueling the need for greater supply. And the cycle goes back to the beginning.
When the business cycle doesn't run smoothly, it can have consequences as disastrous as the Great Depression. That's why governments intervene to try to manage the economy. For example, if it appears that inflation is rising too quickly, the Federal Reserve (the central bank of the U.S. charged with handling monetary policy) may decide to raise interest rates to curtail spending. On the other hand, if the economy is performing poorly, the government may lower taxes to spur consumption and investment.
Interest rates and the yield curve play a very important role in determining economic activity and the performance of the stock market. Higher interest rates increase the costs to businesses and individuals. Companies must pay more to borrow money for capital investments or to fund daily business operations. Individuals pay more for mortgages as well as other loans they may take out to purchase products. Higher interest rates also increase the demand for money to invest in bonds taking money that could or was invested in the stock market.
The yield curve is a plot of the yield on bonds with the same credit quality across different maturities (the link above provides an interesting interactive model of the "living" yield curve). The basic assumption is you get more interest on your investment in a bond by holding it longer. The theory states there is more risk for holding a bond for 10 years than for 5 years, or for 5 years than for 90 days. Bloomberg provides an current chart of the yield curve for U.S. Treasuries at Bloomberg .
As the economy grows and expands the Federal Reserve usually raises interest rates to try to control inflation. When the economy contracts the Federal Reserve will lower interest rates to try to stimulate demand by lowering the costs of borrowing. If you hear that the Federal open market Committee (FOMC) has raised or lowered rates, they are really raising or lowering the federal funds rate for banks. The federal funds rate is the interest rate at which depository institutions lend balances at the Federal Reserve to other depository institutions overnight.
The business cycle has implications for markets and investors. Broadly, a recession often corresponds with a sustained period of weak stock prices, or a bear market. And a healthy, expanding economy that keeps inflation from rising too quickly often corresponds with a bull market, or period of sustained market growth.
Fortunately, there are investment strategies for all parts of the cycle, thanks to the diverse economy we have. Companies that do well when the economy is experiencing good times are called cyclical stocks. Industries that fall under this group include travel and leisure companies, airlines, consumer electronics firms and jewelry makers. Companies that make goods that are necessities, such as food and health care are called non-cyclical stocks. These stocks tend to provide more stability during an economic downturn. During an economic expansion one should invest in cyclical stocks. On the other hand during an economic contraction one should consider investing in non-cyclical stocks.
Sam Stovall's Sector Investing, 1996 states that different sectors are stronger at different points along the business cycle. The table below describes this theoretical model throughout the business cycle.
Stage: |
Full Recession |
Early Recovery |
Full Recovery |
Early Recession |
The graph below, courtesy of StockCharts.com , shows these relationships and the order the key sectors respond to the economic cycle. The Stock Market Cycle precedes the Economic Cycle as investors try to anticipate how the market will react to the changes to the economy.
Sector Rotation Model:
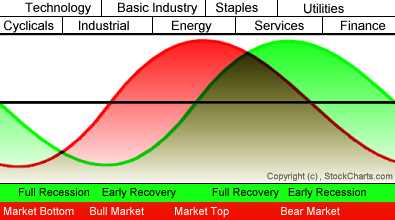
Legend: Market Cycle Economic Cycle
The hard part in all this is identifying where the economy is in the business cycle. As you might realize this is no easy matter and many economists get it wrong. There are many indicators that get published on a regular basis that people use to monitor the economy. Unfortunately, there isn't a simple way to make this strategic decision. The best policy is to not try to predict the business cycle, but rather to monitor the economy looking for signs that it is changing direction. The change in direction takes many months so you have time to make your observations. Keep in mind that the stock market is considered a leading indicator and will attempt to forecast that the economy is beginning to level off or contract and pull back. Unfortunately, these can be false indications as well.
As an investor I seek to understand where we are in the business cycle to help guide me where to look for opportunities. However, I do not try to forecast the cycle since I realize I am no better than many economists who make it a full time job to make these predictions. In fact, if a good opportunity shows up in my scans and it is from a sector that is out of cycle, I will still consider it in my evaluation. However, sector rotation can produce excellent opportunities and must be carefully examined when evaluating the business cycle. Just keep in mind that many investors and gurus are wrong when they claim that we are entering an new stage in the business cycle. This is an art based on experience much more than it is a science.
By Hans Wagner
tradingonlinemarkets.com
My Name is Hans Wagner and as a long time investor, I was fortunate to retire at 55. I believe you can employ simple investment principles to find and evaluate companies before committing one's hard earned money. Recently, after my children and their friends graduated from college, I found my self helping them to learn about the stock market and investing in stocks. As a result I created a website that provides a growing set of information on many investing topics along with sample portfolios that consistently beat the market at http://www.tradingonlinemarkets.com/
© 2005-2022 http://www.MarketOracle.co.uk - The Market Oracle is a FREE Daily Financial Markets Analysis & Forecasting online publication.