


Why Gold Price Will NOT Break Above 1803 – MAP WAVE Analysis
Commodities / Gold and Silver 2012 Nov 26, 2012 - 05:11 AM GMTBy: Marc_Horn

 Previously in my Gold update of the 18 October I assumed a rule break the spike low, and incorrectly scaled a pivot!! Also I have found yearly pivots 0, 1 and 2 which confirms that last Septembers high is Q3.
The recent action has highlighted that the user is wrong - me, and this was not a rule break and the revised count is shown below based on the MAP Wave Analysis rules!
Essentially we need another high a minimum of 1795.84 and maximum 1802.92 before gold can continue forming a base for when confidence in the governments ability to deal with the sovereign debt crisis reaches its tipping point (pivot) Q5 on Y3. The timing is pointing to as early as next year to as late as March 2015.
My previous user rule break assumption from last report.
I am changing yet again the report format so that you can see the wave formation on the wave scales that I use so starting with yearly pivots.
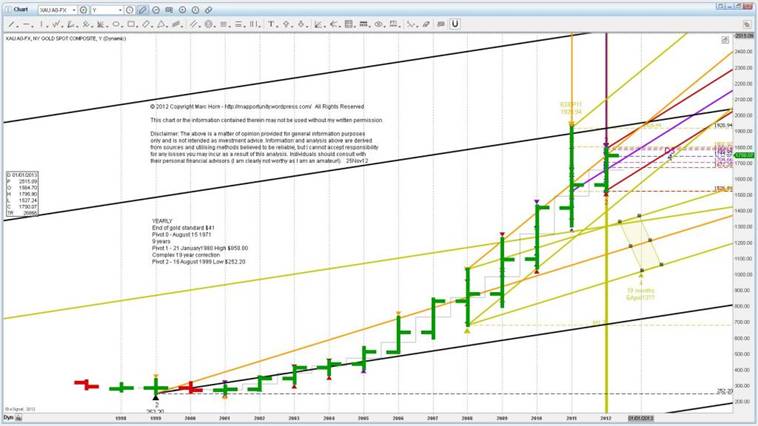
We clearly have not had a a bubble finish yet! You will also see the incorrectly scaled pivots which give the final target area of Q4.
On a monthly pivot scale.
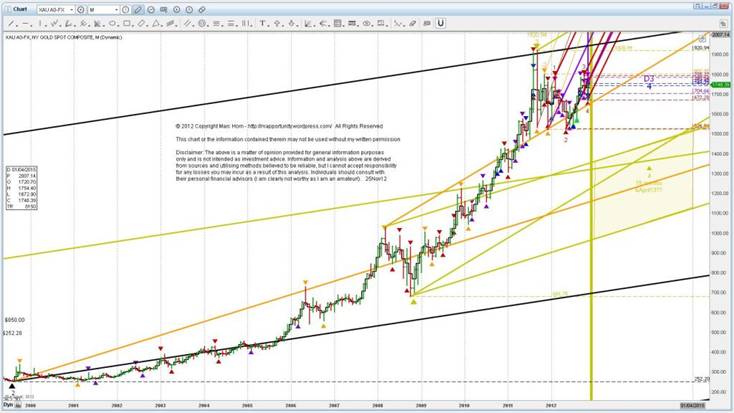
You can see the final "bubble top" of wave 5 following the yearly ML test, retest break and support followed by the monthly MLU test, retest and support before breaking clear to the yearly MLU!
On a weekly pivot scale
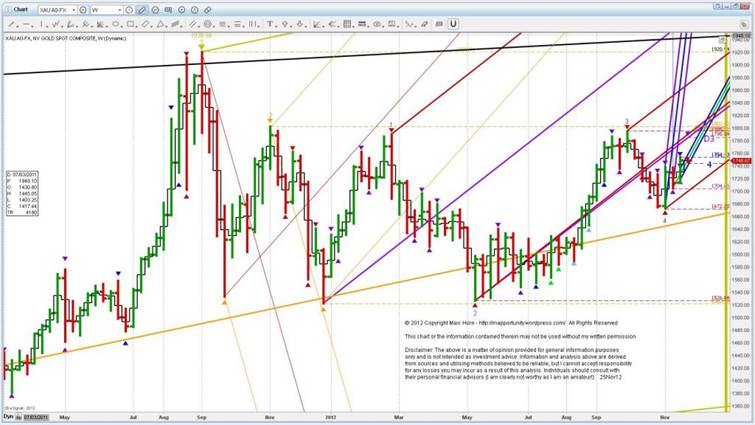
Here you can again see the test, and retest of the Q123ML, which will be followed by the break and retest, all of which is typical price behaviour around these cycle forks!
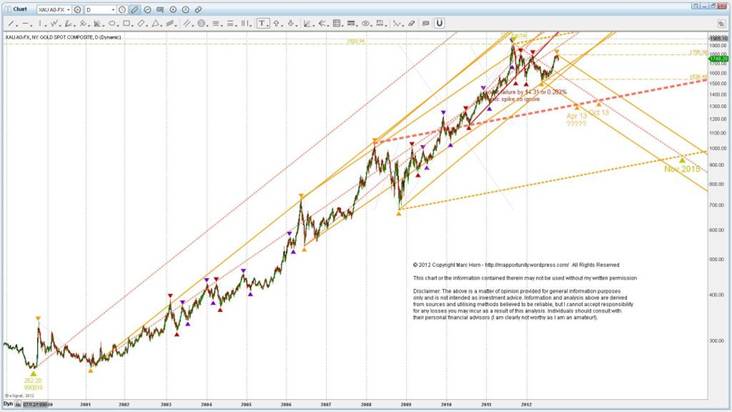
Zooming in on the daily pivot scale
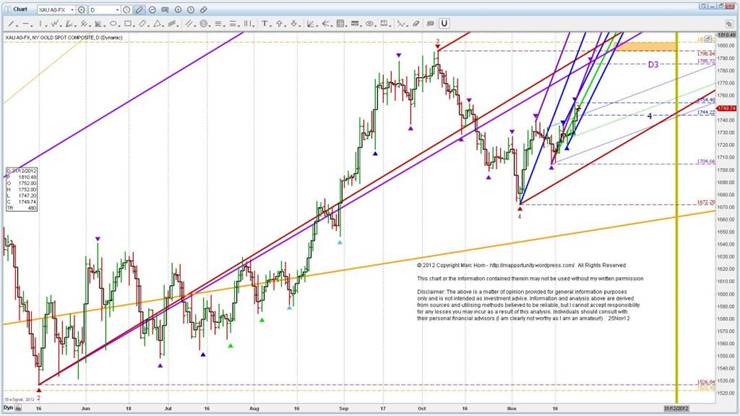
As I stated in the introduction, we need to complete M-4. The window is tight and to stay within MAP Wave Analysis rules this means a final high between 1795.84 and 1802.92, before the break of the M123ML can succeed. This is projected to occur in December, and once D3 is in then a better time frame can be given, and once D4 is in then it can be further refined. This is unlikely to be a spike, but a roll over top.
In the immediate future below is what MAP WAVE Analysis is projecting.
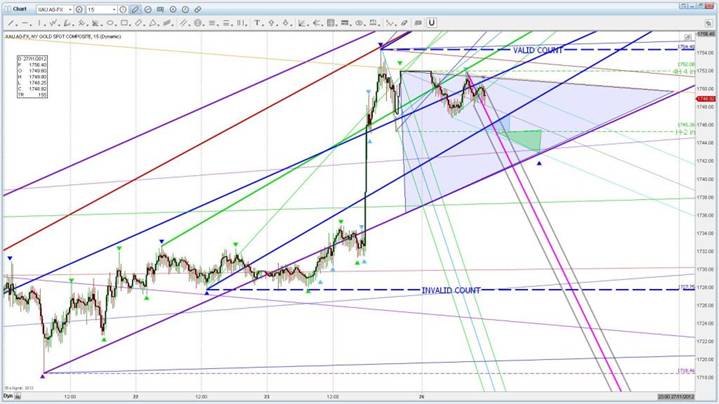
Due to a lack of understanding of the fact that support and resistance ARE NOT horizontal, but time related and depending on the fractal wave scale you are trading that there is NO MAGIC time and price target. This fundamental simplicity just does not exist! MAP WAVE Analysis gives clear validity criteria, as shown above on the 4H scale. These can be applied to whatever your trading pivot scale is.
MAP Wave Analysis, unlike Elliot Wave and Andrews Pitchforks are a systematic methodical rule based approach, details of which can be found either on my blog or here on The Market Oracle and data is archived and updated in a format that is traceable as shown in this SPX update, so that the system can be improved and used as a learning model. Additionally investors can evaluate its effectiveness when making investment decisions.
Click here to follow your duty of Use and copyright is described therein.:
Probabilities are derived from the MAP Analysis methodology described therein,
Click follow on my blog to receive regular FREE market updates and discussion.
For other articles published click here
For more information of how I do what I do http://mapportunity.wordpress.com/ . Comments and discussions very welcome!
The statements, opinions and analyses presented in this site are provided as educational and general information only. Opinions, estimates, buy and sell signals, and probabilities expressed herein constitute the judgment of the author as of the date indicated and are subject to change without notice.
Nothing contained in this site is intended to be, nor shall it be construed as, investment advice, nor is it to be relied upon in making any investment or other decision.
Prior to making any investment decision, you are advised to consult with your broker, investment advisor or other appropriate tax or financial professional to determine the suitability of any investment.
© 2012 Copyright Marc Horn - All Rights Reserved Disclaimer: The above is a matter of opinion provided for general information purposes only and is not intended as investment advice. Information and analysis above are derived from sources and utilising methods believed to be reliable, but we cannot accept responsibility for any losses you may incur as a result of this analysis. Individuals should consult with their personal financial advisors.
© 2005-2022 http://www.MarketOracle.co.uk - The Market Oracle is a FREE Daily Financial Markets Analysis & Forecasting online publication.