


Gold Push to New Highs Lacks Strength
Commodities / Gold & Silver Feb 24, 2008 - 01:01 PM GMTBy: Merv_Burak

 The price of gold continues into new highs BUT the strength of such recent move keeps getting weaker. Either the strength needs to improve soon or the weakness may dominate.
GOLD : LONG TERM
I thought it was time to check in again on the long term P&F Chart. Since we last looked in on it we have gone though a consolidation period and have broken into new highs. Most important, the action has now given us a higher value as a major support which, if breached, may give us a bear market reversal signal.
At the present time there is no indication from the P&F chart that there is any emphasis towards a reversal but it has given us a new reversal level. At the present time a move down to the $885 level would break below two previous lows and below an up trend line. However, that up trend line is not the primary one but a secondary line so, although valid, the odds of a whip-saw effect after such break is considerably higher than breaking the primary line which is around the $810 level. It's all a difference in the odds.
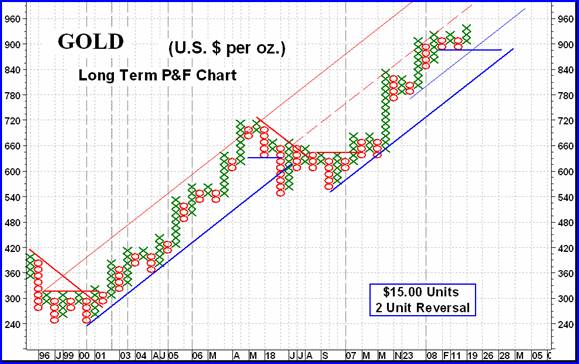
As for the normal long term indicators, gold is far from its positive moving average line. The weighted moving average I use (see the intermediate term chart) is just around the primary up trend line shown in the chart. The more popular 200 day simple moving average line is even lower down. The momentum indicator is yet not confirming gold's move to new highs and remains below its previous end of Jan level. The volume indicator is above its positive long term trigger line (a positive) but still below its level from last Nov (a negative). All in all, the long term rating remains BULLISH .
INTERMEDIATE TERM
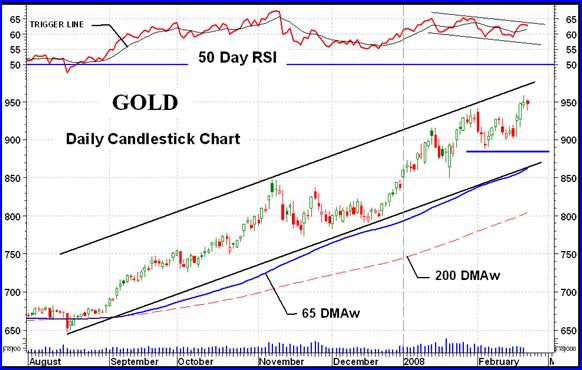
The intermediate term continues to show no let-up in its primary bullish trend since it last started back in August, although it has had a few periods of rest along the way. Once more, although the price continues to make new highs, the momentum indicator is not. As we can see from the chart, the momentum indicator has been tracking a downward path over the past several weeks. Its trend seems to be downward, which is in opposition to the price trend. The price, although heading higher, is almost butting its head up against its upper channel line that the action has been trapped in since the start of this bullish move. It could still move higher but at this time any dramatic upward move is not envisioned. Should the price trend decide to stabilize and even move lower, that support above the $885 level seems like a good resting level.
Just the facts here. The price of gold continues above its intermediate term positive sloping moving average line. As long as that keeps up we have no real immediate concern from the intermediate term perspective. The momentum indicator is still well inside its positive zone, but as mentioned above, it is showing a weakening condition. It has been oscillation above and below its trigger line and at this time is above it. As with momentum, the volume indicator (not shown) is showing signs of weakness. Although it is above its trigger line it has been unable to exceed its late Jan peak, and the mid Jan peak was unable to exceed its Nov peak. Lower and lower highs in the volume indicator while the price of gold is making new highs is not a sign of a strong market. However, still putting the indicators together there is nothing that actually says the trend has halted, so the rating remains as a BULLISH intermediate term rating.
SHORT TERM
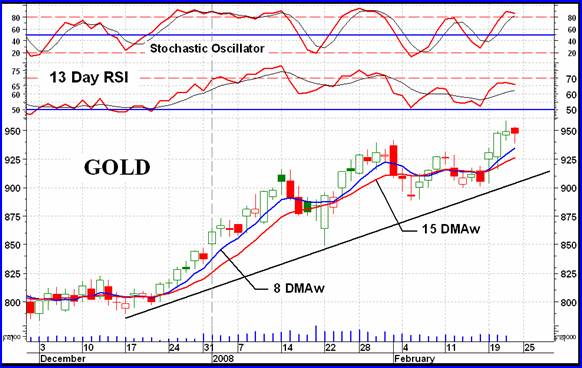
The one striking feature of the short term chart is the continued positive nature of the momentum indicator. It has gone through some volatility over the past few months but has stayed in its positive zone throughout. Despite this it is giving us a warning of weakness. Its high peak reached during the mids Jan price high has not been breached even though the gold price has breached its high on more than one occasion. After a couple day bout on the down side the moving average is once more pointing upward with the price above. We also have an up trend line to go with all that. So, on the short term one must still continue with a BULLISH rating. As for the immediate term direction, that;s a hard one. After Thursday I would have been inclined to say the downside was in force. After Friday I'm somewhat unsure. Let's just call it a lateral immediate term trend. A close above $958 or below $938 may change that to the appropriate direction.
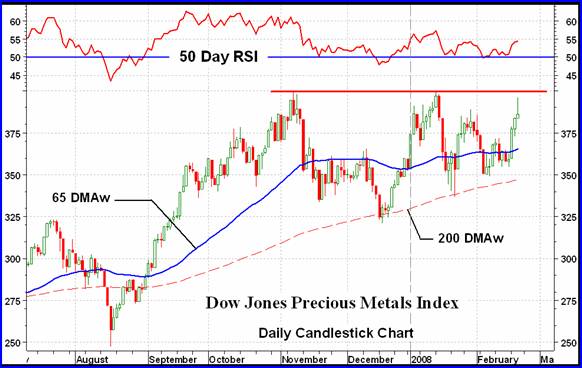
NORTH AMERICAN GOLD INDICES
Well once more we are back to the Dow Jones Precious Metals Index, the least followed of my five major Indices reviewed in rotation. We've had a reasonable rally in the major Indices over the past few days. It seems to have come to an end. The action on Friday could represent a reversal of trend action. The Index opened about where it closed the previous day. It them climbed and then dropped back to where it started with very little end of day movement, but with a long tail above the close. This is not the action of a continuing market. All of the major Indices had this kind of daily action of Friday so it is a general trend. The other interesting features of the chart are the serious resistance at the 400 level and the continuing weakness in the momentum indicator. All this suggests that the recent rally has come to an end and next week will most likely see more action on the down side than the up side.
MERV'S PRECIOUS METALS INDICES
Too bad I don't have a daily version of the various Merv's Indices or of the Composite Index. They would probably show the same action on Friday as is seen in the Dow Jones Precious Metals Index. We only have weekly prices based upon the Friday close so the Composite and the rest of the Merv's Indices show significant gains on the week without the potential Friday reversal indication. The Composite of all the Indices in my Table of Precious Metals Indices shows a gain of 6.4%. This is mostly due to the better performance of the major Indices versus the slightly lower performance of the average stocks represented by the various Merv's Indices.
MERV'S GOLD & SILVER 160 INDEX
The average price of the 160 stocks represented in this universe gained 5.6% on the week. There was no real best group, the double digit gains, which were quite a few, were scattered within all sectors of the universe. The winners and losers emphasized the trend of the week with almost a 4 to 1 ration of winners to losers. The summation of individual stock ratings all moved higher with only the long term not yet in the bull camp. It has moved up but only into the NEUTRAL level.
The Index closed above both the intermediate term and long term positive moving averages lines and both momentum indicators are in their positive zones. The Index finished the week about in the middle of a year long congestion area. It would take some effort getting out of this area decisively but once out the next major trend would be set. For now, even though both time periods are rated as BULLISH, there is just too much resistance ahead to place too much emphasis on this rating. The resistance level is less than 6% ahead and another good week could take us there.
MERV'S QUAL-GOLD INDEX : MERV'S SPEC-GOLD INDEX : MERV'S GAMB-GOLD INDEX
All three Indices had a good week with the Qual Index advancing 7.1%, the Spec advancing 5.4% and the Gamb in the middle. All had there share of double digit winners with only the Gamb-Gold Index having a double digit loser. The year long congestion area noted in the universe is not as easily seen in these sector Indices. Only the Gamb Index has a lateral congestion area. The other two Indices has a half year congestion with an Index rise to well above that area over the last half year. In all three sectors the momentum indicator is still giving signs of weakness although not emphatically. Both momentum indicators are now back in their positive territory. As for the moving average, both the intermediate and long term are positive with the Indices closing above them. Both time periods for all three sectors can be rated as BULLISH. It is noted that the long term rating for the Gamb-Gold Index is still NEG in the table. That is due to the different momentum indicator used and the use of weekly versus daily data.
SILVER
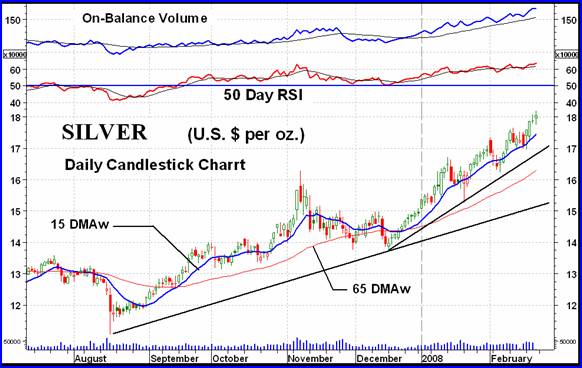
After bottoming out in Aug and having all indicators going positive in Sept Silver has been a positive performer since. It had one close call in Dec but remained positive. The latest move has all indicators on side. The most positive feature is the move by both the momentum and volume indicators into new high ground thereby confirming the move by the price into new high territory. We have the possible makings of a bearish FAN PRINCIPLE. The first two FAN trend lines can be drawn but the third and most important cannot yet. Should we be able to draw the third of our FAN trend lines then we could have a blow-off stage in progress which inevitably results in a bear move of some length. Since we are looking at intermediate term trend any such bear move would be of an intermediate term length. But let's see if in fact it develops. For now all systems are GO for all three time periods.
MERV'S QUAL-SILVER INDEX : MERV'S SPEC-SILVER INDEX
With silver once more out performing gold it's a surprise that the Silver Indices did not out perform the Gold Indices. They did okay but just a little under the performance of the gold Indices. The Qual-Silver Index closed the week higher by 6.9% while the Spec-Silver Index closed higher by 6.3%. As for winners and losers, the winners outnumbered the losers by a 4 to 1 ration in the Qual-Silver Index and by a 3 to 1 ratio in the Spec-Silver Index. As for the summation of individual stock ratings, this is mixed with the Qual-Silver Index, the better performer of the two over the past several months, lagging in this category. The short term is bullish by 60% while the long term barely got into the bullish range with 50%. The intermediate term was neutral. As for the Spec=Silver Index, both its short and intermediate term ratings were in the bullish side with 74% and 56% respectively. The long term was neutral.
As for the charts and indicators, the week has seen both the intermediate and long term moving averages for both Indices turn upward as the Indices closed above the lines. Both momentum indicators for both Indices also moved upwards into their positive zones. Therefore, the ratings for both time periods, for both Indices can only be rated as BULLISH.
Merv's Precious Metals Indices Table
That's it for another week.
By Merv Burak, CMT
Hudson Aero/Systems Inc.
Technical Information Group
for Merv's Precious Metals Central
Web: www.themarkettraders.com
e-mail: merv@themarkettraders.com
Before you invest, Always check your market tirming with a Qualified Professional Market Technician
For DAILY Uranium stock commentary and WEEKLY Uranium market update check out my new Technically Uranium with Merv blog at www.techuranium.blogspot.com .
During the day Merv practices his engineering profession as a Consulting Aerospace Engineer. Once the sun goes down and night descends upon the earth Merv dons his other hat as a Chartered Market Technician ( CMT ) and tries to decipher what's going on in the securities markets. As an underground surveyor in the gold mines of Canada 's Northwest Territories in his youth, Merv has a soft spot for the gold industry and has developed several Gold Indices reflecting different aspects of the industry. As a basically lazy individual Merv's driving focus is to KEEP IT SIMPLE .
To find out more about Merv's various Gold Indices and component stocks, please visit www.themarkettraders.com and click on Merv's Precious Metals Central . There you will find samples of the Indices and their component stocks plus other publications of interest to gold investors. While at the themarkettraders.com web site please take the time to check out the Energy Central site and the various Merv's Energy Tables for the most comprehensive survey of energy stocks on the internet. Before you invest, Always check your market timing with a Qualified Professional Market Technician
Merv Burak Archive |
© 2005-2022 http://www.MarketOracle.co.uk - The Market Oracle is a FREE Daily Financial Markets Analysis & Forecasting online publication.