


Goldman Sachs Short-Term Bullish, Long-Term Bearish Call On Gold
Commodities / Gold and Silver 2013 Jan 23, 2013 - 07:13 PM GMTBy: Richard_Shaw

 Goldman Sachs predicts a gold spike in the near term to $1800+, but eventual decline to about 1200 by 2018. Their view is that safe haven seeking behavior will reduce as economies heal and interest rates rise, and risk assets appreciate. In particular, they are concerned that when interest rates revert from negative real rates to positive real rates, the price of gold will experience strong negative pressures, which they feel will probably outweigh other factors that may produce positive price pressures.
The Goldman view is still an outlier. They are not alone, but are in a growing minority of investors who are either skeptical about the potential for gold to maintain its rate of price appreciation, or that see other better opportunities.
We would add that there is a discomforting level of broad retail interest in owning gold, and a media saturation level by gold marketing companies.
MANY DO NOT AGREE
There, of course, has been a chorus of objections to the Goldman forecast, including those who suggest that Goldman has a practice of recommending one thing to move a market, and then doing the opposite for themselves. Then, there are the arguments about gold as the anti-Dollar and the continuing debasement of the Dollar that lies ahead as a result of both ever expanding deficits and Fed easing and monetary base expansion.
Wyatt Investment Research pointed to a less than stellar recent history for Goldman making gold calls. They said:
- January 2011: Goldman forecasts a top in gold prices of around $1,750 an ounce, perhaps by the end of 2011. By September, the yellow metal had reached a high of just under $1,900 an ounce.
- November 2011: Having changed its tune to bullish, Goldman suddenly predicts a major push in gold prices. The bank upped its 12-month gold target to $1,930 an ounce. The price has been more or less flat since.
- May 2012: Goldman predicts that gold will advance to $1,840 an ounce within six months. At the time, gold had reached a 12-month bottom of less than $1,550 an ounce. While gold did advance over the ensuing six months, by early November it was below $1,700 – having never really flirted with the $1,800 mark.
VALUATION RELATIVE TO WHAT?
< other to relative -- matter a is currency, in paid price as expressed are they assets, of>
Assets like stocks and bonds have comparative yields and income growth prospects, all of which get rolled up in to prices. Gold, however, has no yield (in fact it has a negative yield in the form of costs for transportation, storage and insurance or other protection). But gold has to be compared to something to decide how many currency units should be used to buy it.
Goldman Sachs takes the position, that while there are multiple factors that impact the valuation of gold, the most powerful factor is the degree to which real interest rates are negative or positive.
When real interest rates are negative, there is no yield opportunity cost to holding gold; but when real rates are positive, holding gold entails foregoing some interest earnings potential. The greater the negative real rate, the stronger the upward pressure on gold; and the greater the positive real rate, the stronger the urge to earn cash yield, and therefore the stronger the negative price pressure on gold.
They say it is not so much the level of inflation, but whether interest rates are greater than or less than inflation, that drives gold's price. And, this is heavily a matter of expectations, as well as current conditions.
Certainly, there are other factors, and Goldman references a few, but in the present moment, their view is that the level of real interest rates is and will be the key driver.
They believe the Fed will eventually have to reduce or stop its rate suppression measures, at which time real interest rates will move to their natural positive level, and the desire to own gold will reduce. That they say will cause the price of gold to decline.
GOLD ETF
GLD is the largest gold bullion ETF (has more gold than all but a small number of country central banks). Its existence and the ease of access to, and holding of, gold is believed by some to be significantly responsible for the run up in the price of gold. If so, rotation of investor interest out of “safe haven” assets into other assets in an improving economy would take away an important gold demand component.
This chart of GLD (priced virtually as 1/10 the price of gold) shows its flagging price since mid-2011. The chart begins on October 1, 2007 (effectively the S&P 500 stock market high prior to the 2008 crash).
The blue line is a linear regression best fit trend line, extended to the end of 2013 — ending at 195 (~ gold 1950).
The red line is a 20% (bear market) negative offset from the 1-year trailing high price — 139 (~ gold 1390).
The tan line is the 200-day exponential moving average — 163 (~ gold 1630).
The green parabolic line is the 90% probable price range through the end of 2013, based on the 1-year trailing volatility of GLD — high 188, low 141 (~ gold high 1880, gold low 1410.

WHAT GOLDMAN SAID
Here are some excerpts from the early December 2012 Goldman report (via Business Insider):
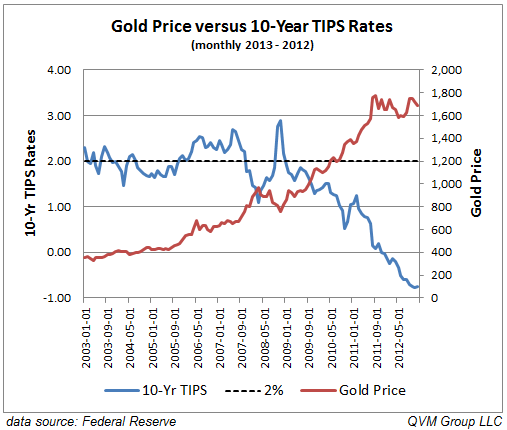
Gold cycle likely to turn in 2013; lowering gold price forecasts … We lower our 3-, 6- and 12-mo gold price forecasts to $1,825/toz, $1,805/toz and $1,800/toz and introduce a $1,750/toz 2014 forecast. While we see potential for higher gold prices in early 2013, we see growing downside risks. …Assuming a linear increase in US real rates back to 2.0% by 2018, as proxied by the 10-year US TIPS yield, we expect that gold prices will continue to trend lower over the coming five years and introduce our long-term gold price of $1,200/oz from 2018 forward.
GOLD VERSUS 10-YEAR TIPS
Here is a chart of the price of gold versus the rates on 10-year US TIPs referenced in the Goldman statement. The earliest data available from the Fed is as of 2003.
MORE OF GOLDMAN STATEMENT
More detailed Goldman comments included:
Improving US growth outlook offsets further Fed easing. Our economists forecast that the US economic recovery will slow early in 2013 before reaccelerating in the second half. They also expect additional expansion of the Fed’s balance sheet. Near term, the combination of more easing and weaker growth should prove supportive to gold prices. Medium term however, the gold outlook is caught between the opposing forces of more Fed easing and a gradual increase in US real rates on better US economic growth. Our expanded modeling suggests that the improving US growth outlook will outweigh further Fed balance sheet expansion and that the cycle in gold prices will likely turn in 2013. Risks to our growth outlook remain elevated however, especially given the uncertainty around the fiscal cliff, making calling the peak in gold prices a difficult exercise. [underscore and color added by QVM]
Beyond real interest rates, fluctuations in the monetary demand for gold also exert an influence on gold prices. Our forecast currently embeds physical gold demand from ETFs and central banks growing in 2013 at the 2009-2012 pace, with ETF purchases slowing in 2014. In our forecast, this steady monetary gold demand helps slow the decline in prices over the coming years. Given the risk around this assumption, we also considered alternative paths for physical gold demand but found that, while not negligible, the impact of gold prices to stronger or weaker monetary demand for gold remains modest compared to the influence exerted by real rates and the Fed’s QE. As a result, it would require a significant further increase in monetary demand for gold to change our outlook for gold prices. While a very significant increase in monetary gold demand by EM investors and central banks could hold the potential for such a large impact, it is also worth noting that a decline in gold prices pushing ETF gold holdings sharply lower would in turn precipitate this fall in gold prices.
Our framework for evaluating gold prices relates the real (inflation-adjusted) price of gold to real interest rates and the monetary demand for gold. As a result, a higher rate of US inflation would inflate our forecasted gold price proportionally. For now, our economists view inflation above the Fed’s target as a low probability risk given: (1) inflation expectations have remained well anchored despite significant expansion of the Fed’s balance sheet, (2) the margin of economic slack will only gradually decline given their expected slow decline in unemployment, and (3) we further forecast that commodity prices will remain more stable than in prior years. Finally, even if higher inflation materializes, its impact on gold prices could be offset by: (1) US real interest rates rising more quickly than we anticipate if the economic recovery is accelerating, or (2) an end to the Fed’s aggressive balance sheet expansion if inflation expectations become unhinged.
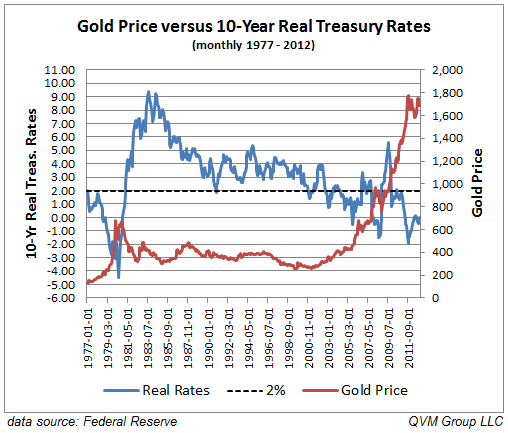
GOLD VERSUS COINCIDENT REAL INTEREST RATES
Here is a chart of gold versus 10-year real Treasury rates. The Fed has much longer rate histories for nominal rates, which we have adjusted here by CPI. It seems to generally support the thesis that gold is negatively reactive to negative real interest rates. Note the gold spike in the late 1970′s when real rates fell below 2%, followed by a decline when real rates rose above 2%, and then began a rise again as real rates fell below 2% again in the early 2000′s. Note these real rates are for current conditions, whereas the TIPS rates mentioned by Goldman are forward looking.
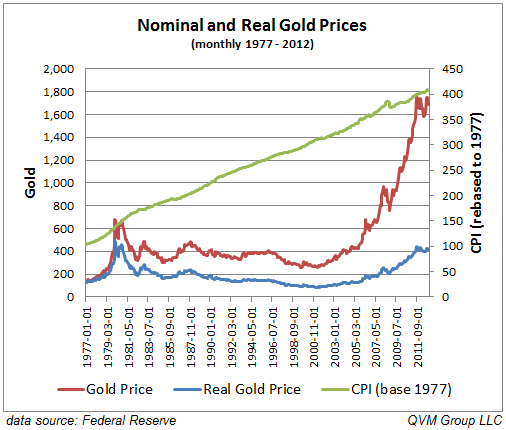
NOMINAL GOLD VERSUS REAL GOLD PRICES
Here is a chart of gold prices and real gold prices since 1977 (calculated by dividing gold price by CPI rebased to 1977):
By Richard Shaw
http://www.qvmgroup.com
Richard Shaw leads the QVM team as President of QVM Group. Richard has extensive investment industry experience including serving on the board of directors of two large investment management companies, including Aberdeen Asset Management (listed London Stock Exchange) and as a charter investor and director of Lending Tree ( download short professional profile ). He provides portfolio design and management services to individual and corporate clients. He also edits the QVM investment blog. His writings are generally republished by SeekingAlpha and Reuters and are linked to sites such as Kiplinger and Yahoo Finance and other sites. He is a 1970 graduate of Dartmouth College.
Copyright 2006-2013 by QVM Group LLC All rights reserved.
Disclaimer: The above is a matter of opinion and is not intended as investment advice. Information and analysis above are derived from sources and utilizing methods believed reliable, but we cannot accept responsibility for any trading losses you may incur as a result of this analysis. Do your own due diligence.
Richard Shaw Archive |
© 2005-2022 http://www.MarketOracle.co.uk - The Market Oracle is a FREE Daily Financial Markets Analysis & Forecasting online publication.