


Dow Stock Market Index To 14,000 ... and Beyond?
Stock-Markets / Stock Markets 2013 Feb 05, 2013 - 05:08 PM GMTBy: Frank_Holmes

 If you've been a hibernating bear lately, you've missed a ton of positive news, as U.S. construction spending rose, ISM manufacturing data beat expectations and the country added 157,000 jobs. In addition, the JP Morgan Global Purchasing Managers' Index rose to 51.5, staying above the expansion level for a second month in a row. The strengthening data, as well as improving investor sentiment, helped the Dow hit 14,000 for the first time since 2007.
For the month of January, U.S. stocks experienced the best month in two decades. Per the Stock Traders' Almanac market indicator, the "January Barometer," the performance of the S&P 500 Index in the first month of the year dictates where stock prices will head for the year. Let's hope so. As Adam Shell from USA Today writes, "While there's no guarantee that what happens in the first month of a new year will continue for the remaining 11 months, history is on the side of investors."
Shell asked for my thoughts on this trend and I told him that sentiment has improved in part because several uncertainties have been removed from the market. Read the rest of the story here.
Sentiment among individuals, advisors and traders has experienced a sudden spike recently, says BCA Research. Its latest Bloomberg numbers show that 53 percent of those surveyed expect equities to be the best-performing asset class over the next year. This represents a "17-point jump over the previous poll in November, and the highest reading in the four-year history of the survey," says BCA.
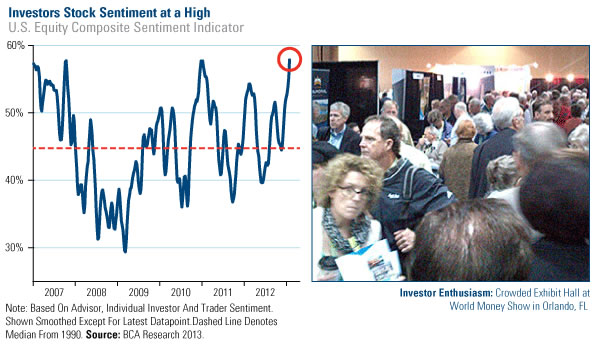
My anecdotal experience this week at the World Money Show in Orlando, Florida supports the view that investors are going "all-in" for equities, as the exhibit hall and conference rooms were packed with thousands of enthusiastic investors looking to gain insights. We enjoyed good conversations and I'm happy to have contributed a few ideas at the general session that attendees could immediately put into action.
As a result of the sentiment that rose faster than the summer heat in the Sunshine State, it's common to question if the market has climbed so high that it might correct and revert to a long-term mean.
Take a look at the oscillator to see today's incredible shift in context with its historical moves. Using 10 years of data, the S&P 500 Index has moved one standard deviation from its mean over the past 60 trading days. The MSCI Emerging Markets Index is only about a half of a standard deviation from its mean over the same time frame. These charts indicate that the indices are not at extreme levels, like the low we experienced in 2009 or the high a few months later. Rather, the stocks are moving within their normal band of volatility.
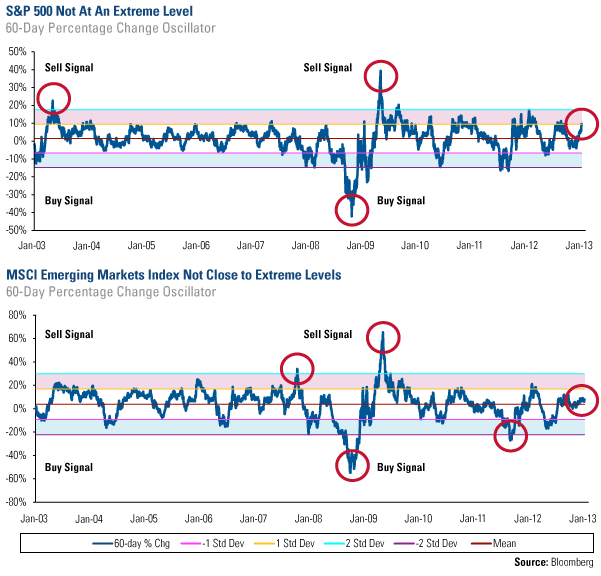
This gauge has been a reliable indicator for our investment team, as markets that enter the extreme territory have historically reverted back to their mean. However, don't panic if a correction should occur, as it would be healthy and reflective of the normal volatility inherent in both U.S. and emerging markets.
BCA believes, "equities should outperform Treasurys over a cyclical horizon of two-to-three years." The research firm points to the relatively strong earnings season in the U.S. and the Federal Reserve's ongoing monetary stimulus, "which should provide a tailwind for stocks." Here are three more reasons to be positive on equities:
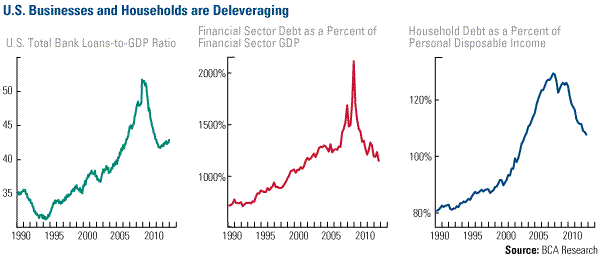
1. U.S. businesses and households are deleveraging
After hitting a peak, you can see in each of the charts below that there has been progress in bringing down the levels of debt across businesses as well as individual households. Less debt gives consumers and companies more confidence to invest, spend and hire.
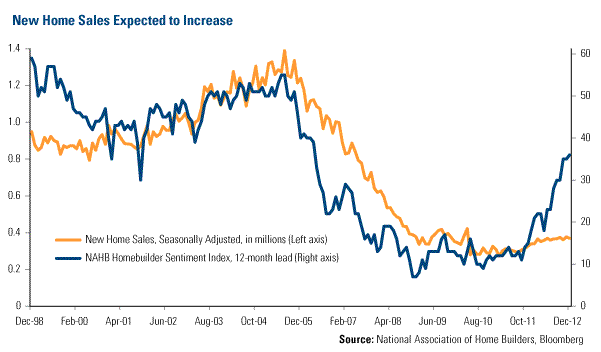
2. New Home Sales Should Increase
Home builders have become increasingly optimistic, as measured by the NAHB Homebuilder Sentiment Index, which has climbed significantly higher in recent months. Historically, new home sales have eventually followed, which is positive for employment, commodity demand, collateral stimulation, cars and appliances.
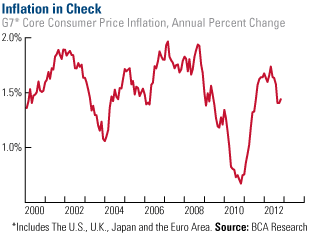
3. Inflation Remains Low
As you can see in the chart, inflation remains low in Japan, Europe, the U.S. and the U.K., with core consumer price inflation falling below 1.5 percent, according to BCA Research. Even though many developed nations are printing money and are experiencing the "most extreme monetary stimulus in modern times," inflation is stable.
So will the Dow go beyond 14,000? Although you can't predict how hot the weather will be this summer, the clouds appear to be parting to reveal the sun today. Make sure your asset allocation positions your portfolio to shine.
For more updates on global investing from Frank and the rest of the U.S. Global Investors team, follow us on Twitter at www.twitter.com/USFunds or like us on Facebook at www.facebook.com/USFunds. You can also watch exclusive videos on what our research overseas has turned up on our YouTube channel at www.youtube.com/USFunds.
By Frank Holmes
CEO and Chief Investment Officer
U.S. Global Investors
U.S. Global Investors, Inc. is an investment management firm specializing in gold, natural resources, emerging markets and global infrastructure opportunities around the world. The company, headquartered in San Antonio, Texas, manages 13 no-load mutual funds in the U.S. Global Investors fund family, as well as funds for international clients.
All opinions expressed and data provided are subject to change without notice. Some of these opinions may not be appropriate to every investor.
Standard deviation is a measure of the dispersion of a set of data from its mean. The more spread apart the data, the higher the deviation. Standard deviation is also known as historical volatility. All opinions expressed and data provided are subject to change without notice. Some of these opinions may not be appropriate to every investor. The S&P 500 Stock Index is a widely recognized capitalization-weighted index of 500 common stock prices in U.S. companies. The NYSE Arca Gold BUGS (Basket of Unhedged Gold Stocks) Index (HUI) is a modified equal dollar weighted index of companies involved in gold mining. The HUI Index was designed to provide significant exposure to near term movements in gold prices by including companies that do not hedge their gold production beyond 1.5 years. The MSCI Emerging Markets Index is a free float-adjusted market capitalization index that is designed to measure equity market performance in the global emerging markets. The U.S. Trade Weighted Dollar Index provides a general indication of the international value of the U.S. dollar.
Frank Holmes Archive |
© 2005-2022 http://www.MarketOracle.co.uk - The Market Oracle is a FREE Daily Financial Markets Analysis & Forecasting online publication.