


HUI Gold Stocks Index Head and Shoulders Patterns
Commodities / Gold and Silver Stocks 2013 Feb 18, 2013 - 02:43 PM GMT

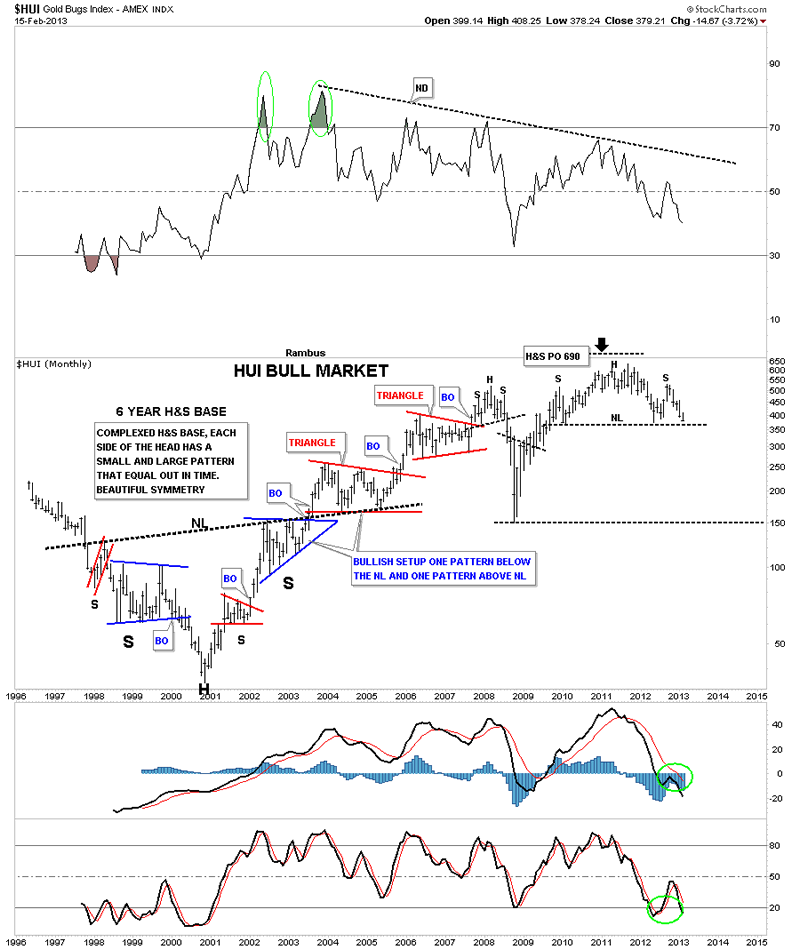
Tonight I want to show you a long term monthly chart for the HUI. It seems there is alot of disbelief that if a H&S pattern is too big that it some how makes it invalid or not to be trusted. I’m curious how that rumor ever got started? Nothing could be further from the truth IMHO.
Below is a monthly chart of the HUI that shows a massive 6 year inverse, complex H&S base, that launched the bull market for the precious metals stocks back in 2001. There is a certain beauty that 6 year H&S base has that most wouldn’t recognize. If you look on each side of the Head you will see two chart patterns, one large blue formation and one small red formation. They are positioned just the opposite on each side of the head. This doesn’t change the time component as the left and right shoulders measures out very close to each other. At the very top of the chart you can see what that big 6 year H&S based measured to. As you can see it measured up to 690 which was just a tad higher than the actual all time high.
The Chartology of the entire chart is one of beauty and symmetry which some will see and others won’t. They say beauty is in the eye of the beholder. What do you see?
Gary (for Rambus Chartology)
FREE TRIAL - http://rambus1.com/?page_id=10
© 2013 Copyright Rambus- All Rights Reserved
Disclaimer: The above is a matter of opinion provided for general information purposes only and is not intended as investment advice. Information and analysis above are derived from sources and utilising methods believed to be reliable, but we cannot accept responsibility for any losses you may incur as a result of this analysis. Individuals should consult with their personal financial advisors.
© 2005-2022 http://www.MarketOracle.co.uk - The Market Oracle is a FREE Daily Financial Markets Analysis & Forecasting online publication.