


S&P Index Stock Market Elliott Wave Analysis & Forecast
Stock-Markets / Forecasts & Technical Analysis Feb 26, 2007 - 12:30 AM GMTBy: Dominick

Last week I stated: We now have the potential of either seeing a final diagonal that the forum has been alerted to for months now, or an acceleration that will have most traders on the wrong side and flat broke within days. I haven't changed a thing about my view, but I'm not going to force a position if the market's out to get me. As members already know, I'm prepared to trade both ends of the trend.
Many weeks ago I had an upside target of 1472, and since last Monday's post, the target has been adjusted to 1462/1470. At this point that level is very doable, but much higher than that won't be a good thing for short traders.
We came into the holiday-shortened week looking at some precise targets in the S&P and, as trading kicked off Tuesday morning, some members were probably thinking the top was in and were preparing for a big move to the south side. This immediately stopped, of course, when they saw my support level at 1450/52 in the ES hold (1 on the chart below) for a quick ten point reversal. The rally on Tuesday came to within two points of the 1462 lower target, but the index went back on Thursday to miss it by less than a half a point.
As the members following along in chat observed, this was a perfect week to illustrate exactly how pattern recognition pays off. On Tuesday we had rallied (2) in something I couldn't use for the current working pattern. I suggested that we roll our positions just as the trend charts were about to do the same, a decision which ultimately paid off when Wednesday opened with a gap down (3).
Being traders, we went long after I posted to key off 1454.50. The low for the move was 1454.25.
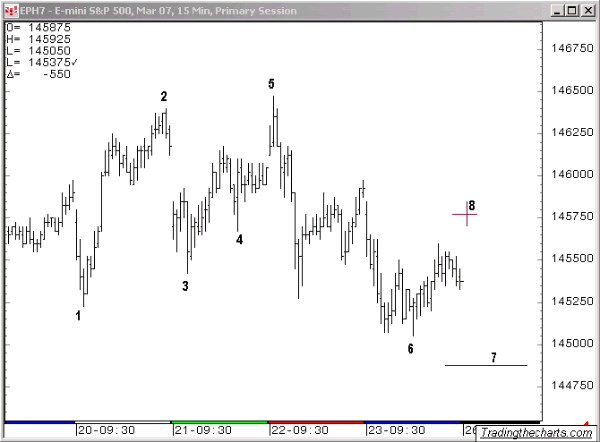
We then focused on what we suspected was a triangle and, wouldn't you know it, the E wave drop (4) came right at the release of the Fed minutes. Knowing that we might have a triangle in play, we waited for that drop with open arms and rode the reversal up to the high of the week.
Even though the small rally hit our lower target of 1462 (5), I surely didn't see it as the end of the advance. Still, we took profits as it seemed more like a place where the bears were going to make a stand and hold price from going where it couldn't without invalidating their counts, something I started to mention in last week's update. I immediately considered that high a B (phony) wave and looked to see if price would get back down to slightly above 1449 and reverse again. Friday's low was 1450.50 (6). We went into the weekend flat as there might be a lower low coming (7), but a gap up above (8) also puts us back long.
As you can see, rolling targets up or down and staying with the trend is an important part of my Elliott wave strategy, what I call "unbiased". For trading both ends of the trend, nothing else comes close. Sure, by the time we finally top readers will tag me as the "1 more high" guy, but it's what the market continues to lay out there and if you see it, you've got to trade it.
The bottom line is that the high is thought to be in for the bears but only a B wave for me as I write this, and I would need a serious move down starting Monday to change that setup. And, as the trading world continues to wait around and plan for a top, we continue to take much more out of the market than the puny four point move this week.
Looking forward, I think there's a nice trade first thing next week from either a gap up or a new low below this week's. My opinion is still that we're in extra innings. If it's a double header I'll have to stay for the next game, but not until they take out our line in the sand. In real-time I see decent sentiment for a turn, but I can't get it on my indicators. I'll wait a bit longer to see if they appear and, if we can stall out in a range that has been set within the forum, we'll finally execute. The time frame is anytime within the next 2 weeks. Remember the "Does the Italian guy get the turn" update? Here comes his turn again on the Dow.
Or, maybe we just need to poke and fake below this uptrend channel from way back when Tradingthecharts.com got seriously bullish? If this idea takes hold and we start to advance impulsively, you know what we'll do. Come what may, I'm sure this time we're really going to hear about going "to DA moon" as many bears have finally started getting long, which puts a capitulation rally on the menu. If we do lose the uptrend, though consider it a job well done at 1462. Either way, we got the skills to profit on any move.
Some interesting setups are unfolding and a weekly update simply won't capture them. You now have the overall idea, but if you want to profit on the interesting times ahead, join for at the low membership fee of only $50 per month .
Metals
Be sure to read the weekly Precious Points updates! Joe's been covering the precious metals markets for us with his unique, broad-based perspective. Now that gold is back in the headlines you don't want to miss your piece of the action!
Have a great week trading, and don't forget:
"Unbiased Elliott Wave works!"
By Dominick
For real-time analysis, become a member for only $50
If you've enjoyed this article, signup for Market Updates , our monthly newsletter, and, for more immediate analysis and market reaction, view my work and the charts exchanged between our seasoned traders in TradingtheCharts forum . Continued success has inspired expansion of the “open access to non subscribers” forums, and our Market Advisory members and I have agreed to post our work in these forums periodically. Explore services from Wall Street's best, including Jim Curry, Tim Ords, Glen Neely, Richard Rhodes, Andre Gratian, Bob Carver, Eric Hadik, Chartsedge, Elliott today, Stock Barometer, Harry Boxer, Mike Paulenoff and others. Try them all, subscribe to the ones that suit your style, and accelerate your trading profits! These forums are on the top of the homepage at Trading the Charts. Market analysts are always welcome to contribute to the Forum or newsletter. Email me @ Dominick@tradingthecharts.com if you have any interest.
This update is provided as general information and is not an investment recommendation. TTC accepts no liability whatsoever for any losses resulting from action taken based on the contents of its charts, commentaries, or price data. Securities and commodities markets involve inherent risk and not all positions are suitable for each individual. Check with your licensed financial advisor or broker prior to taking any action.
© 2005-2022 http://www.MarketOracle.co.uk - The Market Oracle is a FREE Daily Financial Markets Analysis & Forecasting online publication.