


Stock Markets Risks Unacceptably High and Rising
Stock-Markets / Stock Markets 2013 Jun 17, 2013 - 10:07 AM GMTBy: Brian_Bloom

 Post GFC, US corporate profits have been very likely rising for reasons that are more related to cost savings and margin increases than to real revenue growth. These cost savings have now worked their way through the system and future US corporate profit growth will be more dependent on price inflation and/or sales volume growth.
US balance of payments may improve as a result of improved energy exports but, because the country is now oriented to a service economy, any growth in export volumes of manufactured goods is unlikely to impact significantly on the economy as a whole. In any event, with the rest of the world in recession, the likelihood of a growth in export volumes is low. With government spending sequestered, an implication is that employment opportunities will have to be driven by private enterprise.
With the above in mind, the fact is that employment has not been growing as a percentage of population. At best, it seems that employment growth is likely to remain close to population growth.
It follows that any price increases at the corporate level are likely to be offset by falls in volume. Further, because real consumer wage rates have been flat to falling, and because over two thirds of the US economy is driven by consumer spending, overall growth in nominal corporate revenues seems likely to be benign.
Finally, the reality is that the main impact of Quantitative Easing has been to drive up investment asset prices. This served to underpin an improvement in consumer and business sentiment which, in turn, prevented an economic collapse. However, Price/Earnings ratios are now once again in the “overvalue” range. A continuation of QE will likely push the P/E ratios to “bubble” levels which will be extremely counterproductive.
Overall, therefore, because overvalue P/E ratios can typically only be justified by high profit growth rate expectations and because US corporate profit growth is likely (at best) to be flat for the foreseeable future, the US equity markets are now looking extremely vulnerable. An adjustment to “fair value” P/E ratios will imply at least a 20% fall in the US stock market assuming revenue volumes do not decline.
Unfortunately, given that QE served to underpin consumer confidence because of rising asset prices, it follows that falling assets prices will likely serve to undermine consumer confidence and to increase savings levels. The flip side of this is that corporate sales volumes (and profits) will be experiencing downward pressure. The above reasoning leads to the overall conclusion that the US equity markets have probably peaked and may fall significantly in the foreseeable future.
***********
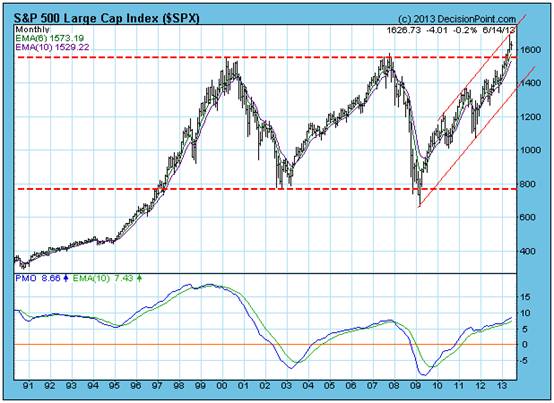
The monthly chart below of the SPX (courtesy decisionpoint.com) gave a technical “buy” signal when it broke to a new high a few weeks ago. But the core question is whether the rise from the low of 800 since early 2009 was a result of the Quantitative Easing. If so, then the latest technical buy signal may be false.
Chart #1 – Monthly chart of S&P 500Industrial Index
There is a limit to how far corporate profits can rise as a consequence of financial engineering. At the end of the day, profits flow from a simple formula:
Revenue – costs = profits
There is no doubt that corporate profits have been rising in recent times but the question that needs to be addressed is: What has been driving this rise?
1. Has it been falling costs or rising revenues?
2. If rising revenues, has this been driven by price (and margin) increases or by volume increases?
Common sense dictates that if profits have been rising for any reason other than increased volumes of sales, then continuing profit increases will be unsustainable.
Employment Costs
Historically, manufacturing productivity in the US has been increasing because of increasing automation
Chart #2: US Production output vs Employment numbers
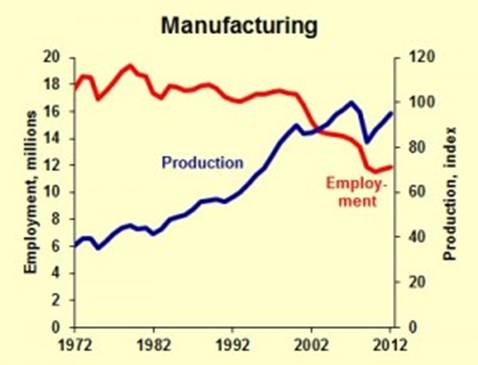
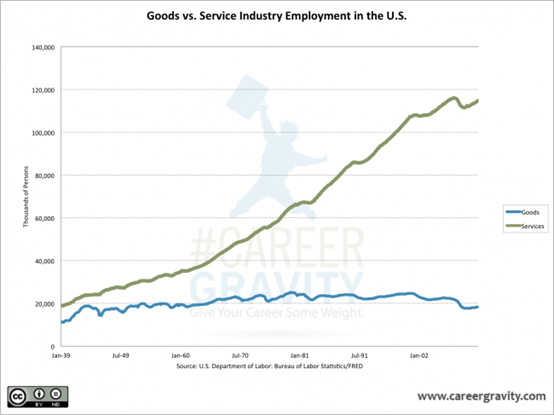
But the US is no longer a manufacturing oriented economy.
Chart #3: Goods vs Service Industry Employment in the US
Source: http://www.careergravity.com/goods-vs-service-industry-employment-trends-chart-of-the-week/
Employment in general in the US did not rise in May 2013 and the percentage of the population that is employed has generally been flat for the past 12 months.
Quotes:
· “Both the number of unemployed persons, at 11.8 million, and the unemployment rate, at 7.6 percent, were essentially unchanged in May.”
· “Total nonfarm payroll employment increased by 175,000 in May, with gains in professional and business services, food services and drinking places, and retail trade. Over the prior 12 months, employment growth averaged 172,000 per month.”
· “The employment-population ratio was unchanged in May at 58.6 percent and has shown little movement, on net, over the past year.”
(Source: http://www.lanereport.com/21880/2013/06/u-s-unemployment-rate-up-slightly-to-7-6-percent/ )
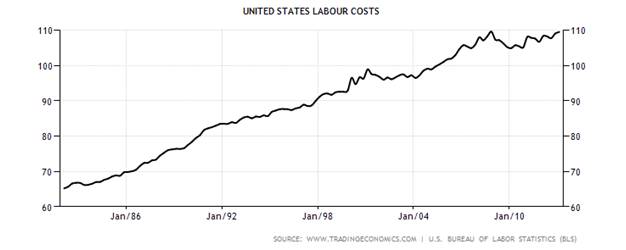
Importantly, labour costs are now back to where they were before the Global Financial Crisis.
Chart # 4: US Labour Costs 1982 - 2013
Source: http://www.tradingeconomics.com/united-states/labour-costs
Finally, there is an upward pressure on hourly labour rates – albeit fairly benign at present:
Quote:
· “In May, average hourly earnings for all employees on private nonfarm payrolls, at $23.89, changed little (+1 cent). Over the year, average hourly earnings have risen by 46 cents, or 2.0 percent. In May, average hourly earnings of private-sector production and nonsupervisory employees, at $20.08, changed little (+1 cent). (See tables B-3 and B-8.)”
(Source: http://www.lanereport.com/21880/2013/06/u-s-unemployment-rate-up-slightly-to-7-6-percent/ )
Interim Conclusion #1
Overall, corporate costs savings associated with lower labour costs post GFC has probably ended.
Cost of Capital
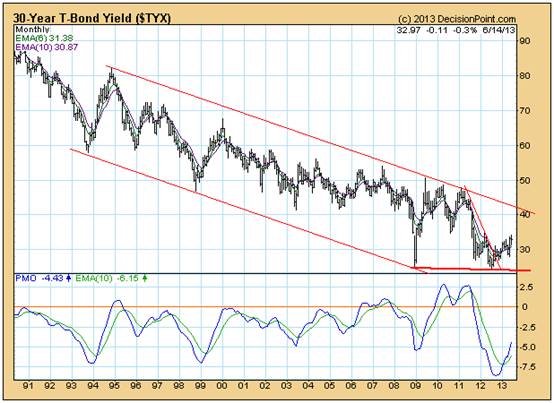
It seems clear from the chart below that interest rates have probably bottomed and that, therefore, corporate cost savings flowing from lower interest rates have probably ended.
Chart # 5: 30 Year Bond Yield
Source: Decisionpoint.com
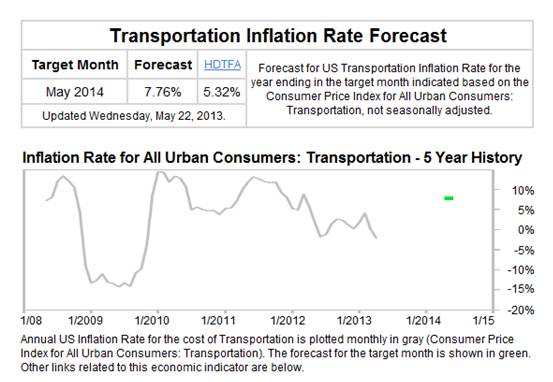
Transport Costs
Corporate savings flowing from lower transportation costs post GFC have very likely ended, as can be seen from the following chart.
Source: http://www.forecast-chart.com/inflation-transportation-cost.html
Chart # 6: US Transport Cost Inflation
Energy Costs
Although energy costs per kW hour have been falling in real terms, because US industry has become increasingly service oriented, these falling costs are likely to be more beneficial to consumers than to US corporations.
Chart #7: Average Retail Price of Electricity in the US
(Source: http://www.eia.gov/totalenergy/data/annual/showtext.cfm?t=ptb0810 )

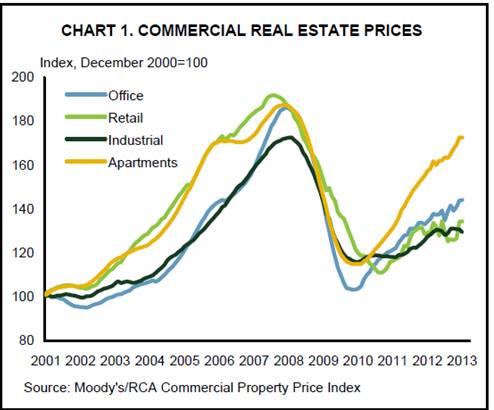
Occupation Costs
Commercial real estate prices have been rising, which implies that any post GFC costs savings in this area have now ended and, if business conditions improve, there will likely be an upward pressure on occupation costs.
Chart #8: US Commercial Real Estate Prices
Source: http://www.td.com/document/PDF/economics/special/USCommercialRealEstate.pdf
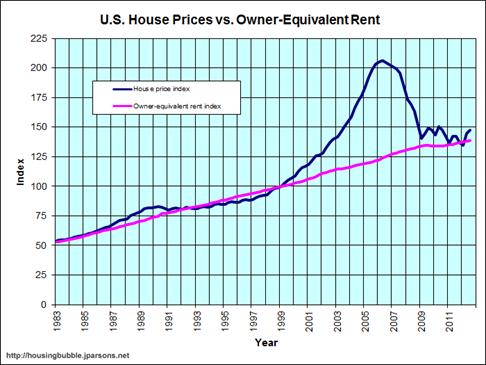
From a different perspective, it seems that any occupation cost benefits from falling domestic real estate prices have also worked their way through the system and consumer disposable incomes will be under pressure because of rising interest rates and rentals.
Chart #9: Domestic Real Estate Prices
Source: http://www.jparsons.net/housingbubble/
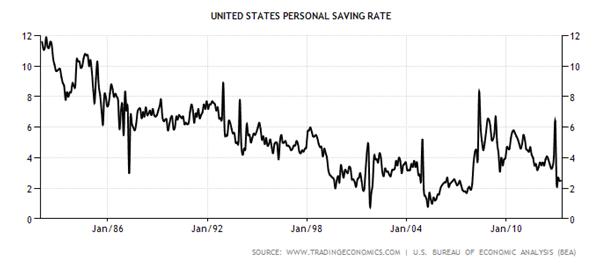
The chart below is noteworthy for the two spikes that have occurred post GFC. Although the savings rate is now just over 2%, the first spike took it to over 8% and the second took it to over 6%. The chart, overall, shows a “rounding bottom” formation, which implies that sentiment is turning. On balance, it seems that the US consumer – who has historically been the driver of sales volumes in the US economy – is now becoming conservative.
Chart #10: US Personal Savings Rates – 1982 – 2013.
Source: http://www.tradingeconomics.com/united-states/personal-savings
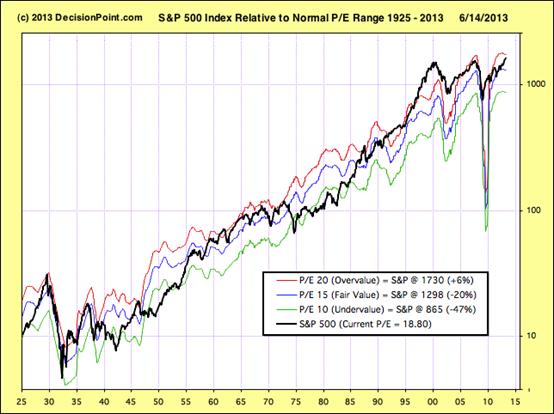
Finally, all the above needs to be seen in context of Price/Earnings ratios on the equity markets. The chart below shows that P/E ratios are in the overvalue range.
Chart 11: S&P Index relative to normal P/E Range
Source: DecisionPoint.com
Overall Conclusion
Flowing from Quantitative Easing, P/E ratios are in overvalued range which, in turn, suggests that investors have an exaggerated optimism regarding the future growth rate of corporate profitability. However, this optimism seems to be misplaced and US equity prices are vulnerable for three reasons in particular:
1. Because the US economy is service oriented and because export opportunities are limited by moribund offshore economies, and because government spending is now subject to sequester, US unemployment rates cannot be expected to fall significantly from current levels.
2. Average hourly pay rates have been flat and there is no reason to expect them to rise in real terms
3. There is evidence that consumers – who are the primary drivers of US economic activity - are becoming cautious about the future
Because QE had an artificially positive impact on the US economy, if share prices fall from this level this will very likely have an exaggerated negative impact on consumer confidence. In turn, this will place a downward pressure on corporate revenues and profits. In turn, it seems likely that we are facing downward pressure on Price/Earnings ratios.
Risks associated with equity investment seem unacceptably high and are rising.
Author, Beyond Neanderthal and The Last Finesse
Beyond Neanderthal and The Last Finesse are now available to purchase in e-book format, at under US$10 a copy, via almost 60 web based book retailers across the globe. In addition to Kindle, the entertaining, easy-to-read fact based adventure novels may also be downloaded on Kindle for PC, iPhone, iPod Touch, Blackberry, Nook, iPad and Adobe Digital Editions. Together, these two books offer a holistic right brain/left brain view of the current human condition, and of possibilities for a more positive future for humanity.
Copyright © 2013 Brian Bloom - All Rights Reserved
Disclaimer: The above is a matter of opinion provided for general information purposes only and is not intended as investment advice. Information and analysis above are derived from sources and utilising methods believed to be reliable, but we cannot accept responsibility for any losses you may incur as a result of this analysis. Individuals should consult with their personal financial advisors.
Brian Bloom Archive |
© 2005-2022 http://www.MarketOracle.co.uk - The Market Oracle is a FREE Daily Financial Markets Analysis & Forecasting online publication.