


GBP-USD: When Support Line Becomes A Resistance Line
Currencies / British Pound Sep 16, 2013 - 03:14 PM GMTBy: Gregor_Horvat

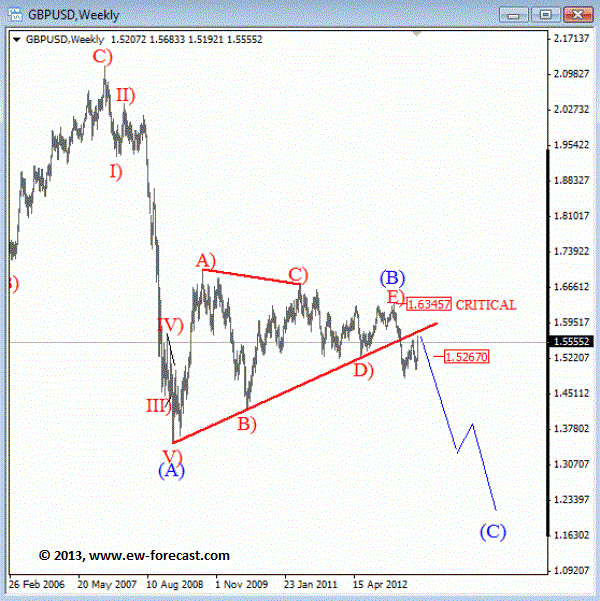
A decline on GBPUSD from 2008 peak to 2009 low was in five waves, which in Elliott Wave theory indicates a direction of a larger trend. This is called an impulse wave, and once this leg is complete you will see a reversal in price, against the trend, normally into a slow, choppy and overlapping price action which is personality of a correction.
Well, this is exactly what has market experienced since 2009 lows. As such, we think that pair made a corrective pattern in wave (B) position called a triangle. In fact, this triangle appears complete after recent break through 2009 trend-line that put prices in bearish mode for wave (C) down. If we are correct, then current pull-back should find a top around 1.6000 area where broken support line will ideally become a resistance line and send prices sharply to the downside.
GBPUSD Weekly Elliott Wave Analysis
On the daily chart we are tracking a corrective rally from March low, which is a complex pattern, most likely a flat in wave II. If we are correct then pair is now in final stages of an up-trend which means that reversal could follow in the near future, especially if we considering an ending diagonal that usually predicts a sharp reversal in price. However, from a confirmation point of view we need impulsive fall back to 1.5700 to call end of a corrective rally.
GBPUSD Daily Elliott Wave Analysis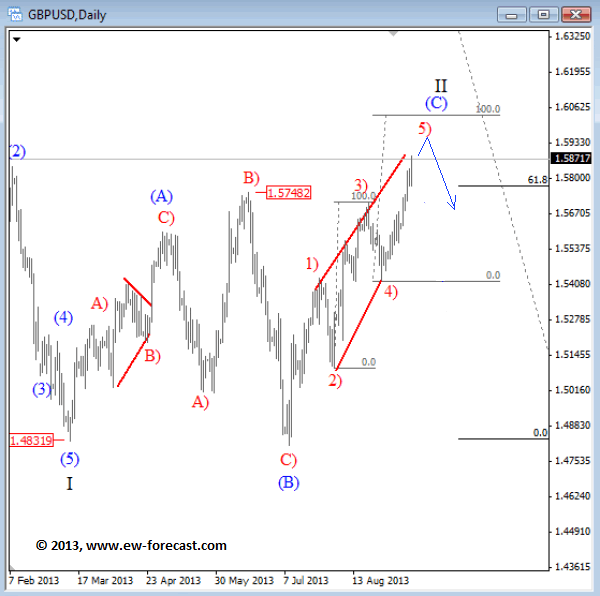
Bio:
Ew-forecast.com is providing advanced technical analysis for the financial markets (Forex, Gold, Oil & S&P) with method called Elliott Wave Principle. We help traders who are interested in Elliott Wave theory to understand it correctly. We are doing our best to explain our view and bias as simple as possible with educational goal, because knowledge itself is power.
Chief Analyst- Gregor Horvat at www.ew-forecast.com
Gregor is based in Slovenia and has been in Forex market since 2003. His approach to the markets is mainly technical. He uses a lot of different methods when analyzing the markets; from candlestick patterns, MA, technical indicators etc. His specialty however is Elliott Wave Theory which could be very helpful to traders.
He was working for Capital Forex Group and TheLFB.com. His featured articles have been published in: Thestreet.com, Action forex, Forex TV, Istockanalyst, ForexFactory, Fxtraders.eu. He mostly focuses on currencies, gold, oil, and some major US indices.
© 2013 Copyright Gregor Horvat - All Rights Reserved
Disclaimer: The above is a matter of opinion provided for general information purposes only and is not intended as investment advice. Information and analysis above are derived from sources and utilising methods believed to be reliable, but we cannot accept responsibility for any losses you may incur as a result of this analysis. Individuals should consult with their personal financial advisors.
© 2005-2022 http://www.MarketOracle.co.uk - The Market Oracle is a FREE Daily Financial Markets Analysis & Forecasting online publication.