Stock Markets follow China Lower - What to expect next as China's crash continues in Asia
Stock-Markets / Forecasts & Technical Analysis Feb 27, 2007 - 11:38 PM GMTBy: Nadeem_Walayat
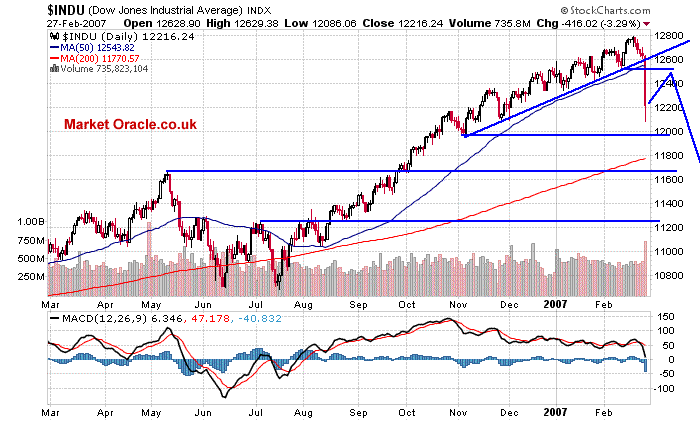
The FTSE 100 Index & Major European indices are expected to open sharply lower following on from sharp drops on Tuesday, which saw China's Shanghai index fall by 9% to 2771. The Dow Jones down by more than 3% to 12217, the largest drop since Sept 11th 2001.
All of the major markets broke key technical levels, signaling that the current bear run is likely to continue for some time. At the time of writing, asian stock markets continue to plunge lower on Wednesday morning, with many markets such as Australia and Japan falling further by nearly 4% at mid session.
What to Expect Next ?
Dow Jones

As with previous large one day sell offs, Tuesday's lows should hold and a corrective rally can be expected that could eventually retrace 50% of the decline from the 12800 high, which coincides with the key chart resistance area of 12,525, before the next leg to the downtrend begins.
The Dow Jones is initially targeting a move down towards the previous high of 11650, with nearest significant support at just below the 12000 level. A 50% retracement of the rally from the 10650 low would represent a support level of 11,725. Therefore the Dow Jones is initially targeting a decline to between 11,650 and 11,725, before the Dow attempts to make a base. Whether the base will hold will become clearer at that time. The timeframe for the downtrend to conclude is by early May 2007.
FTSE 100 Index - Sharp drop expected on the opening.
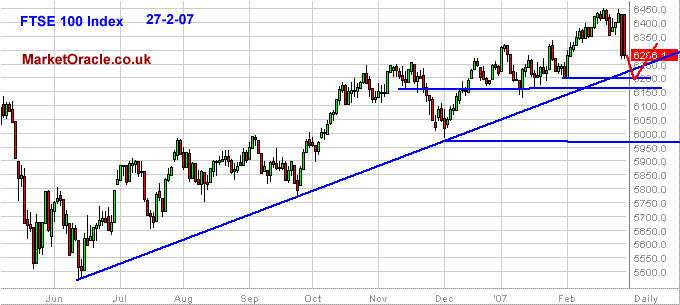
The FTSE closed Tuesday down nearly 150 points at 6286, and is expected to open as much as 100 points lower in London on Wednesday morning, following the ongoing selling in asia overnight and the after hours Wall Street action.

On the technical front, the FTSE looks in a little better shape than the Dow, which means it could just hold above key support at 6200, which would set the scene for a corrective rally back above 6300 over the immediate future, as the above chart indicates.
The key support zone is 6150 to 6200, which is the initial intermediate term target for the FTSE, to begin after the initial corrective rally runs out of steam and the FTSE joins the Dow on another leg lower. Should support at 6150 fail then the next stop for the FTSE would be 6000. The time frame for this move is also to conclude by early May 2007.
If you want to know why the Dow fell and is likely to fall further, then see US Subprime Mortgages Fallout and Declining Housing Market likely to hit the Stock Market
By Nadeem Walayat
(c) MarketOracle.co.uk 2007
The Market Oracle is a FREE Daily Financial Markets Forecasting & Analysis online publication. We aim to cut through the noise cluttering traditional sources of market analysis and get to the key points of where the markets are at and where they are expected to move to next ! http://www.marketoracle.co.uk
© 2005-2022 http://www.MarketOracle.co.uk - The Market Oracle is a FREE Daily Financial Markets Analysis & Forecasting online publication.


