


Crude Oil Price Could Reverse Up from 101-103 Support Zone
Commodities / Crude Oil Sep 26, 2013 - 02:09 PM GMTBy: Gregor_Horvat
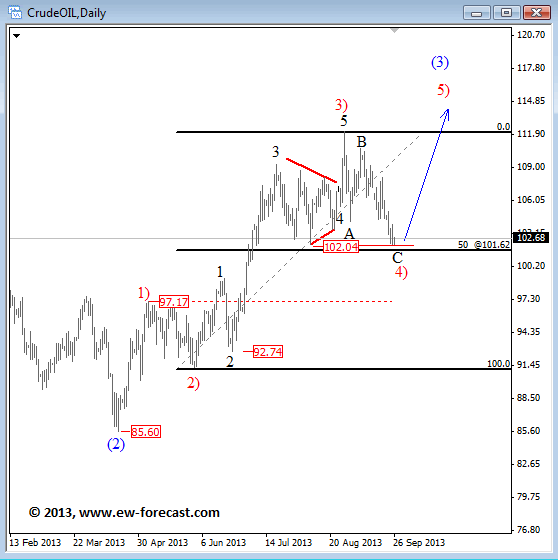
 Few weeks back oil reversed sharply from the 112 high when a five wave rally from 91.00 area completed a larger degree of an extended wave 3). As such, the contra-trend reaction is called a corrective retracement that is now unfolding but maybe near completion.
We are tracking red wave 4) that may look for a support around 50% Fibonacci retracement level compared to wave 3); that’s one of the most important Fibonacci levels when you are looking a reversal point. It’s also important to know that 92 figure represents invalidation level of our bullish forecast, because wave 4) must not fall into the region of a wave 1).
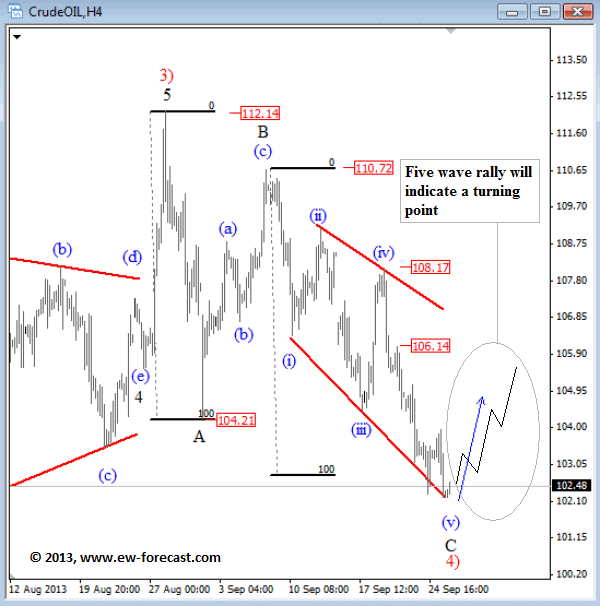
On the 4h chart below we can see that Oil extended its weakness after recent sell-off from 108 zone at the end of the last week. Current bearish leg will delay an upward bullish structure but it does not change the larger picture which suggests that move from the top is corrective; an A-B-C retracement in wave 4) that could look for a completion in 101-103 zone, at wave C - wave A equality level. This has already been tested so bounce in price could be near.
If you are one of the patient traders then you will wait on the bottom to form first, before you may start to consider long entries. So from a confirmation and trading point of view it would be nice to see an impulsive upward reaction back to 106 level to confirm a change in trend; from a bearish corrective retracement up to bullish continuation.
Elliott wave traders will know that impulse is a five wave pattern that occurs in the direction of a larger trend, so only this type of a rally can put bullish waves back in control. In such case traders could be interested in long opportunities.
Written by www.ew-forecast.com | Try our 7 Days Free Trial Here
Ew-forecast.com is providing advanced technical analysis for the financial markets (Forex, Gold, Oil & S&P) with method called Elliott Wave Principle. We help traders who are interested in Elliott Wave theory to understand it correctly. We are doing our best to explain our view and bias as simple as possible with educational goal, because knowledge itself is power.
Gregor is based in Slovenia and has been in Forex market since 2003. His approach to the markets is mainly technical. He uses a lot of different methods when analyzing the markets; from candlestick patterns, MA, technical indicators etc. His specialty however is Elliott Wave Theory which could be very helpful to traders.
He was working for Capital Forex Group and TheLFB.com. His featured articles have been published in: Thestreet.com, Action forex, Forex TV, Istockanalyst, ForexFactory, Fxtraders.eu. He mostly focuses on currencies, gold, oil, and some major US indices.
© 2013 Copyright Gregor Horvat - All Rights Reserved
Disclaimer: The above is a matter of opinion provided for general information purposes only and is not intended as investment advice. Information and analysis above are derived from sources and utilising methods believed to be reliable, but we cannot accept responsibility for any losses you may incur as a result of this analysis. Individuals should consult with their personal financial advisors.
© 2005-2022 http://www.MarketOracle.co.uk - The Market Oracle is a FREE Daily Financial Markets Analysis & Forecasting online publication.