


Fueling The Gold Fire
Commodities / Gold and Silver 2013 Oct 08, 2013 - 05:53 PM GMTBy: Frank_Holmes

 Gold took quite a beating in September, bucking its seasonal average monthly return of 2.3 percent. The political battle between President Barack Obama and Congress, China’s Golden Week, and India’s gold import restrictions likely weighed on the metal.
September’s correction only adds to the negative sentiment toward the precious metal. The assumption from many market pundits is that gold is no longer attractive as an investment. With rising rates and continuing low inflation, U.S. investors believe they have a solid case for selling their holdings.
However, this could be a premature assessment, causing these bears to potentially lose out on a lucrative position.
Allow me to use an ice cube to explain.
One of the strongest drivers of the Fear Trade is real interest rates. Whenever a country has negative-to-low real rates of return, which means the inflationary rate (CPI) is greater than the current interest rate, gold tends to rise in that country’s currency.
Our model tells us that the tipping point for gold is when real interest rates go above the 2-percent mark.
Consider the ice cube, which shows how new equilibriums can have significant effects. At 31 degrees, H2O is a solid chunk, but when the temperature increases, the mass slowly begins to turn into a liquid. Above 32 degrees, ice changes form from solid to liquid, but it’s still made of hydrogen and oxygen.
Because money is like water, when many other economic dynamics, such as population growth, urbanization rates and changes in government policies, reach their tipping point, the velocity of money tends to be altered.
As global investors, we watch for changes in these trends to know how to invest in commodities and markets, find new opportunities and adjust for risk.
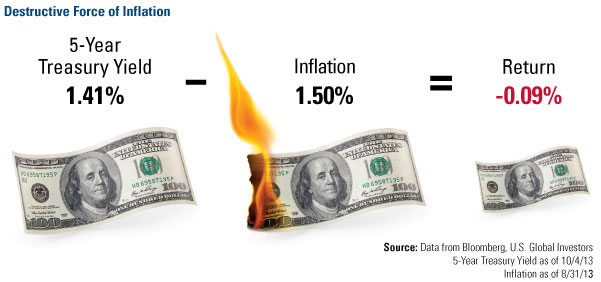
So, how close to gold’s tipping point are we? In other words, what is the real interest rate today? As you can see below, Treasury investors continue to lose money, as the 5-year bill yields 1.41 percent and inflation sits at 1.5 percent. This is nowhere near the 2 percent mark.
I would be worried about gold if real interest rates solidly crossed the 2 percent threshold for an extended amount of time, because it would have a dramatic effect on gold as an asset class. In a high interest rate environment, gold and silver lose their attraction as a store of value.
In order for that tipping point to happen, rates would need to continue rising above inflation, and inflation would need to remain low. These are the forecasts made by many gold sellers today; however I wouldn’t get too trigger happy just yet, as recent data challenges these assumptions.
Take the monthly unemployment figure, which is one of the primary indicators the Federal Reserve studies when evaluating the economy. But depending on the definition of an unemployed person, the numbers reveal different results.
The official U3 unemployment rate, the exact figure Ben Bernanke uses, tracks the total unemployed as a percent of the civilian labor force.
The broadest gauge calculated by the Bureau of Labor Statistics (BLS) is the U6 unemployment rate. For this number, the BLS adds in all those people who are marginally attached to the labor force, plus people working part-time but want to work full-time.
What does “marginally attached to the labor force” mean? These people are neither working nor looking for work but indicate they want a job, are available to work and have worked during some period in the last 12 months. These marginally attached people also include discouraged workers who are not looking for work because of some job-market related reason.
Then there’s a measure of the labor market the BLS tracked prior to 1994. This is the seasonally-adjusted alternate unemployment rate that statistician John Williams continued to calculate. It’s basically the U6 plus long-term discouraged workers.
While the figures closely followed one another from 1994 through 2009, there’s recently been a shift. U3 and U6 have been trending downward over the past few years, whereas Williams’ ShadowStats unemployment rate shows a noticeably upward trajectory. Perhaps the official unemployment figure overstates the health of the economy?
Based on the jobs market, a limited housing recovery and regulations that have been slowing down the flow of money, the Fed may have no choice but to raise rates very gradually to keep stimulating the economy.
Then there’s the suggestion of inflation manipulation. Even though the U.S. has been reporting a low inflation number, things feel more expensive to many Americans. Disposable income has been growing less than inflation in recent years; perhaps that’s why many people feel “squeezed.”
Also consider Williams’ chart below. It shows monthly inflation data going back for more than a century. The blue and grey shaded areas represent BLS’ historical Consumer Price Index (CPI). You can clearly see the wild swings of inflation and deflation, especially during World War I, the Great Depression, and World War II, as well as the stagflation of the 1970s and early 1980s.
However, shortly after disco, bell bottoms, and episodes of “All in the Family” faded from memory, the U.S. adjusted CPI, not once but twice, first in the early 1980s and again in the mid-1990s. If you use the pre-1982 calculation, you end up with a much different inflation picture. This is the area shaded in red.

Figures don’t lie, but liars figure
Way back in 1889, statistician Carroll D. Wright, in addressing the Convention of Commissioners of Bureaus of Statistics of Labor, talked about the impartial and fearless presentation of its data, using the above play on words. He said,
“The old saying is that ‘figures will not lie,’ but a new saying is ‘liars will figure.’ It is our duty, as practical statisticians, to prevent the liar from figuring; in other words, to prevent him from perverting the truth, in the interest of some theory he wishes to establish.”
Wright’s speech seems particularly relevant today.
For patient, long-term investors looking for a great portfolio diversifier, a moderate weighting in gold and gold stocks may be just the answer. And, today, when looking across the gold mining industry, you’ll find plenty of companies that have paid attractive dividends, many higher than the 5-year government yield.
Want to receive more commentaries like this one? Sign up to receive email updates from Frank Holmes and the rest of the U.S. Global Investors team, follow us on Twitter or like us on Facebook.
By Frank Holmes
CEO and Chief Investment Officer
U.S. Global Investors
U.S. Global Investors, Inc. is an investment management firm specializing in gold, natural resources, emerging markets and global infrastructure opportunities around the world. The company, headquartered in San Antonio, Texas, manages 13 no-load mutual funds in the U.S. Global Investors fund family, as well as funds for international clients.
All opinions expressed and data provided are subject to change without notice. Some of these opinions may not be appropriate to every investor.Standard deviation is a measure of the dispersion of a set of data from its mean. The more spread apart the data, the higher the deviation. Standard deviation is also known as historical volatility. All opinions expressed and data provided are subject to change without notice. Some of these opinions may not be appropriate to every investor. The S&P 500 Stock Index is a widely recognized capitalization-weighted index of 500 common stock prices in U.S. companies. The NYSE Arca Gold BUGS (Basket of Unhedged Gold Stocks) Index (HUI) is a modified equal dollar weighted index of companies involved in gold mining. The HUI Index was designed to provide significant exposure to near term movements in gold prices by including companies that do not hedge their gold production beyond 1.5 years. The MSCI Emerging Markets Index is a free float-adjusted market capitalization index that is designed to measure equity market performance in the global emerging markets. The U.S. Trade Weighted Dollar Index provides a general indication of the international value of the U.S. dollar.
Frank Holmes Archive |
© 2005-2022 http://www.MarketOracle.co.uk - The Market Oracle is a FREE Daily Financial Markets Analysis & Forecasting online publication.