


Gold Stocks Bear of a Lifetime Takes No Prisoners
Commodities / Gold and Silver Stocks 2013 Dec 12, 2013 - 02:02 PM GMT

 Today I would like to update some of the Diamonds that have been in play for several months now. Chartology is giving us an edge over most of the other technical disciplines out there , in that it has been showing us the way lower to a T. Nobody but Rambus Chartology folks are seeing the precious metals stocks from this angle that got us short, for the first ride down, one year ago during the first impulse leg down. It was in the first week of December of 2012 that we took our first DUST position and added to it from there until the Kamikaze Portfolio was full. Here we are one year later and we have the exact same setup staring us in the face. This time we are one step ahead of the game by being fully invested in the Kamikaze Portfolio before things broke down.
I have described to you how hard it is to get your initial position to stick before you may get stopped out. Just think of an impulse move as two steps forward and one step back. If you wait and buy in the second step, because it feels more comfortable, you will find yourself underwater at some point which makes it difficult to hang on even though you are right taking a position. It's that step back that gets a lot of investors in trouble. Yesterday, I noticed a couple of red quotes, amongst the sea of green, where we had entered the last of our positions in the Kamikaze Portfolio. This week was the step back. If you had bought back up inside the Diamonds, you felt some pain, but not the kind of pain if you had bought your stock in the last three weeks or so after the breakout. Your emotions will start to kick in and you will question if you've made the right decision.
So lets look at some of the Diamond formations and see how they have showed us the way lower, while most investors don't have a clue to what is actually happening in the precious metals sector. They keep looking at everything but the price action which is the most important aspect to making money in the markets especially in an impulse move, IMHO.
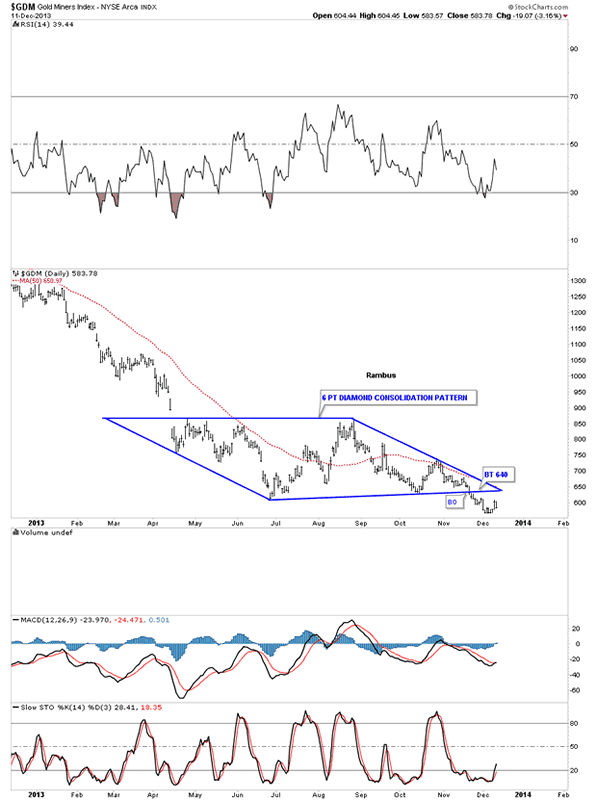
The GDM daily chart shows us its beautiful Diamond consolidation pattern which is now in its fourth week down from the breakout.
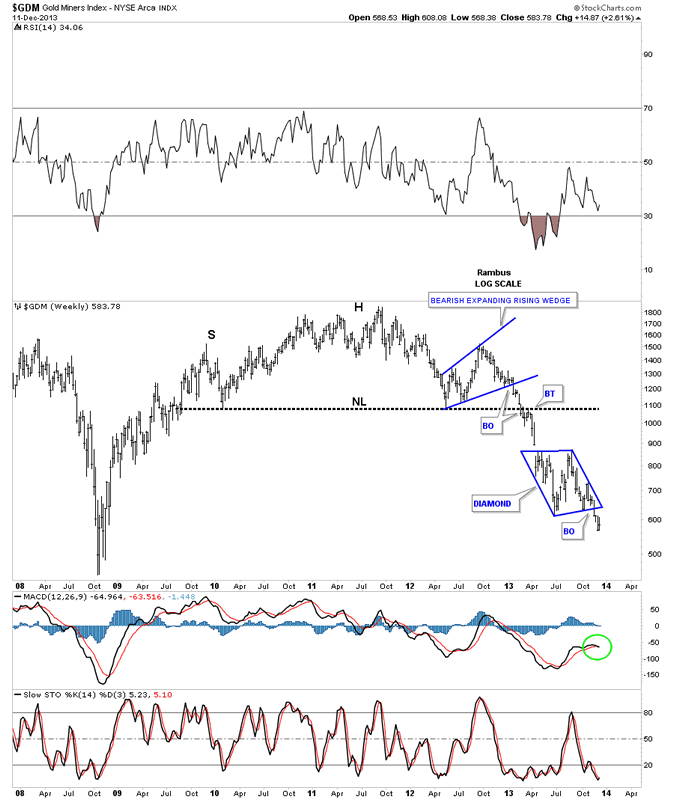
The weekly chart for GDM shows the impulse move down that is now in its fourth week. From a Chartology perspective this chart is as clear as day as to what's happening. It just doesn't get any prettier.
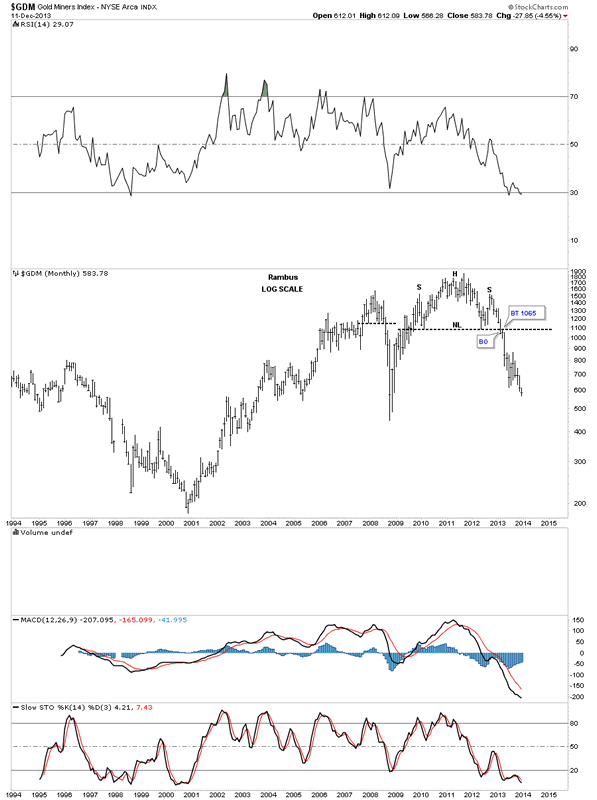
The monthly chart for GDM really puts the bear market into perspective. You have the massive H&S top that reversed the rally off the 2008 crash low. Note the last 5 bars on this monthly chart. Each one is making a lower low and the price action is now trading below the June low that so many gold investors were trying, with all their might, to call a double bottom. Now that the double bottom is out of the picture I wonder what will be their next reason for a bottom? Compare the price action from the rally off the 2008 crash low where most of the monthly bars made a higher high to our current bear market, that is showing us the exact opposite. Each monthly bar is making a lower low except where there is a consolidation pattern.
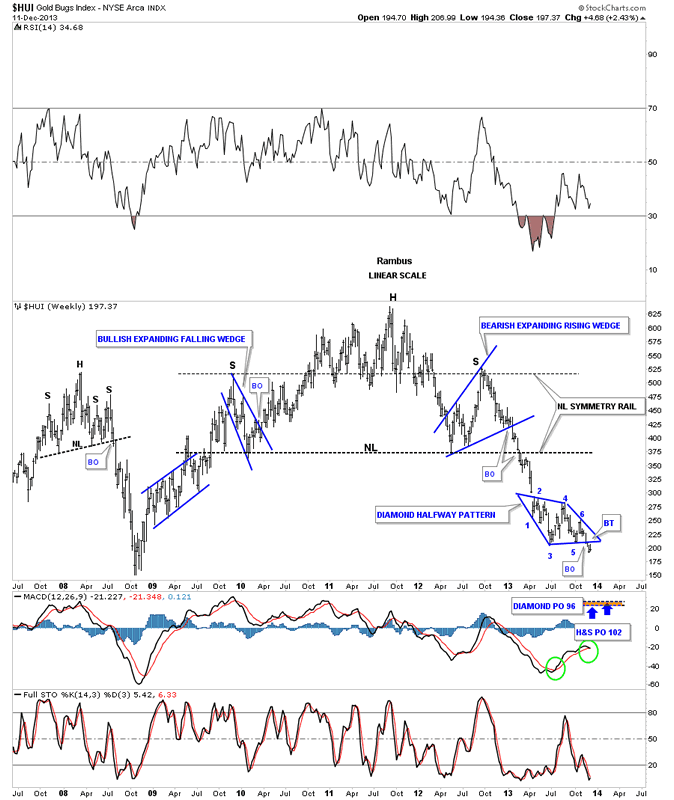
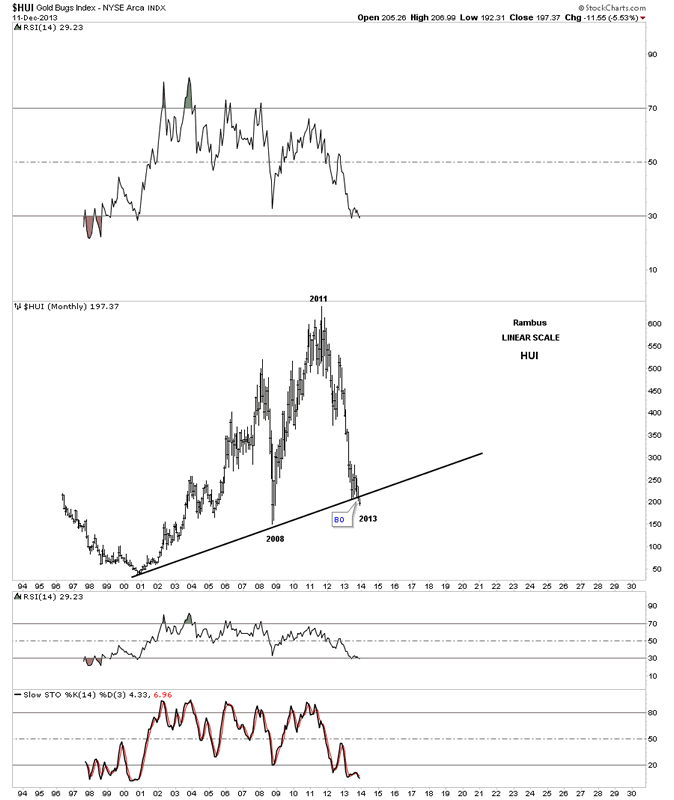
Lets look at the weekly linear scale chart for the HUI which shows our Diamond consolidation pattern having made an attempt this week at a backtest. A move below last weeks bar will more than likely tell us the backtest is over and done with as it will setup a new lower low for the move.
This next chart is a monthly linear scale chart that shows the total history for the HUI. The month of December still has alot of trading left but you can see on the chart below that the major bottom uptrend rail has been broken. I'm in awe of how this bear market if unfolding when I look at this chart. Many think we should be playing with the stock market stocks instead of shorting the precious metal stocks. Folks, this chart shows you why we have been shorting the precious metals stocks instead for the most part. You just don't find moves like this everyday in any of markets and to recognize something on this scale, early enough, can change your world.
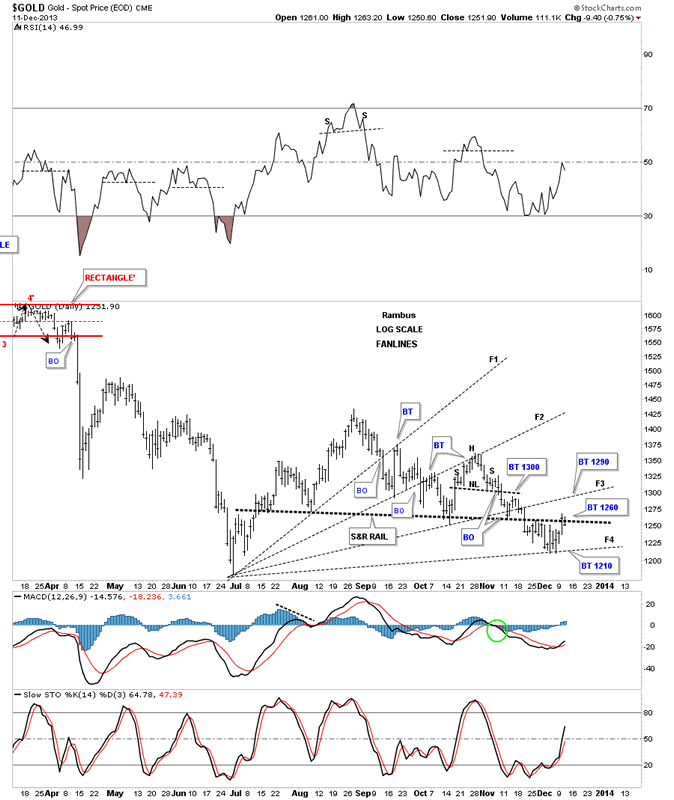
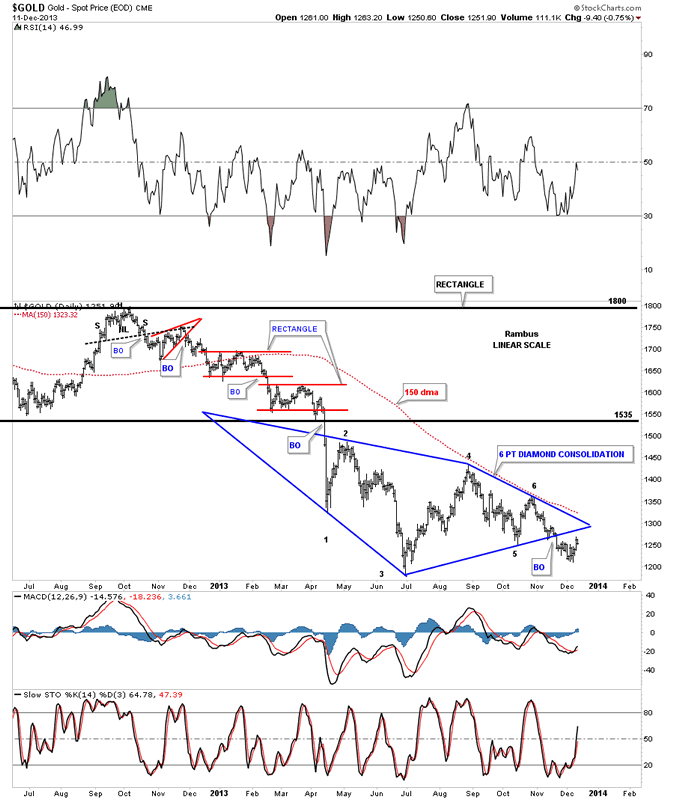
Lets take a look at gold from several different perspectives. The first chart I would like to show you is a daily chart with fanlines on it. Normally when a fanline is broken you will get a backtest to the underside, in this case. When the third fanline is broken to the downside is when you the pattern is complete. I have added a fourth fanline that came at the previous low at 1210. The heavy black dashed trendline is actually a neckline that is part of this complex consolidation pattern. Note the last two days of trading where the price action is backtesting the heavy dashed trendline or Neckline. This is a critical test taking place right now on gold.
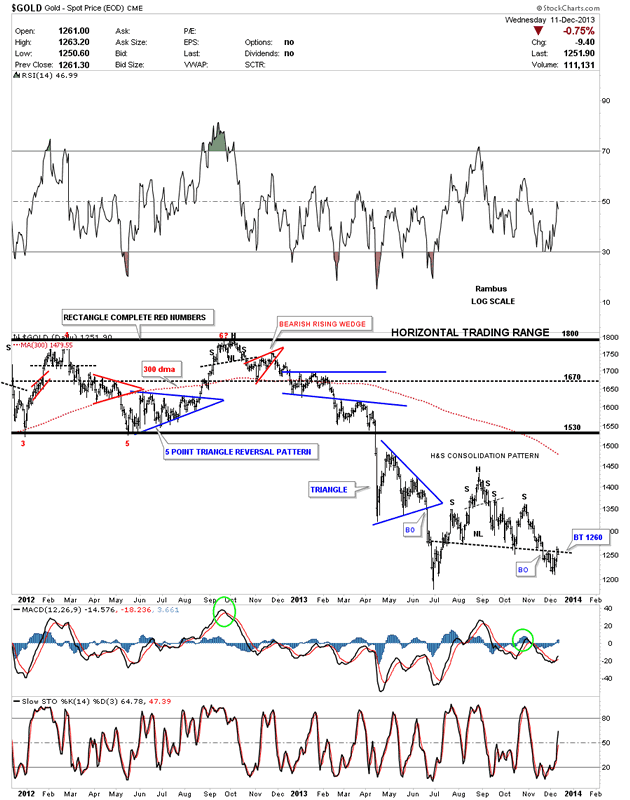
Below is a daily chart for gold that shows the H&S consolidation pattern in more detail. Keep in mind this H&S consolidation patterns is just part of the bigger and more complex Diamond.
This next daily chart for gold shows the complex blue diamond with the many smaller chart patterns that make up this pattern. You can see the smaller blue dashed triangle that started this Diamond followed by smaller H&S tops at each reversal points within the Diamond. You can see the bigger H&S pattern that we looked at on the chart above. I can also make a case for a symmetrical triangle that would start at the June low. All those lesser chart patterns equals a big Diamond consolidation pattern.
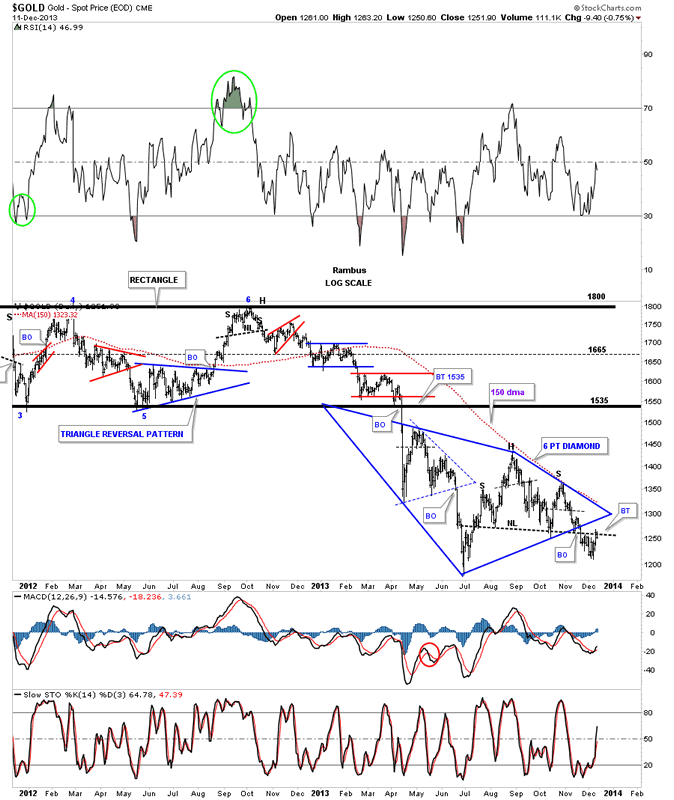
Below is the 6 point Diamond consolidation, as a stand alone consolidation pattern, without all the other smaller patterns.
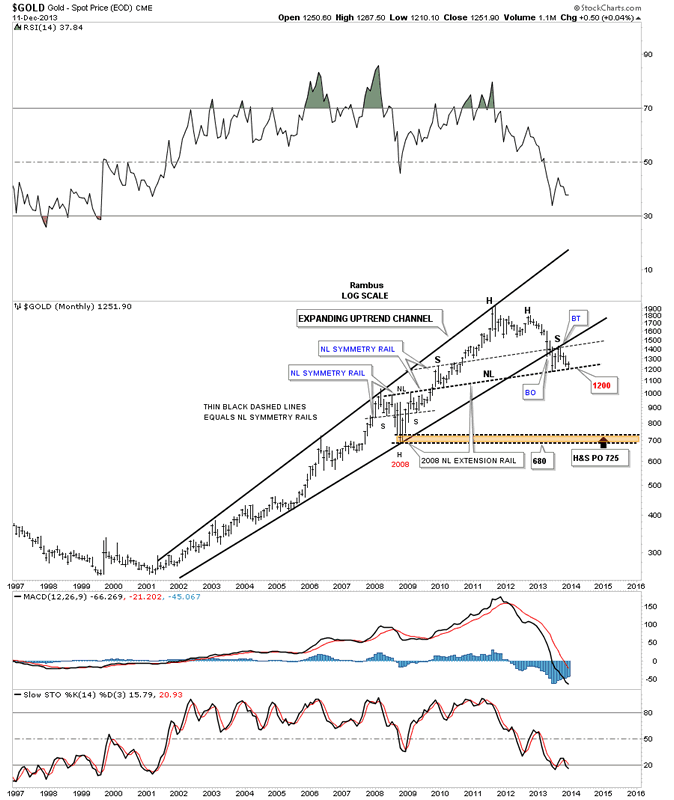
Lets check on the progress of the potential big H&S top that has yet to breakdown. We are getting some important information tho as it's bouncing off the potential neckline. I know it cause some pain but it tells us this neckline is hot and if it is broken to the downside it will signal the completion of this possible very large H&S top.
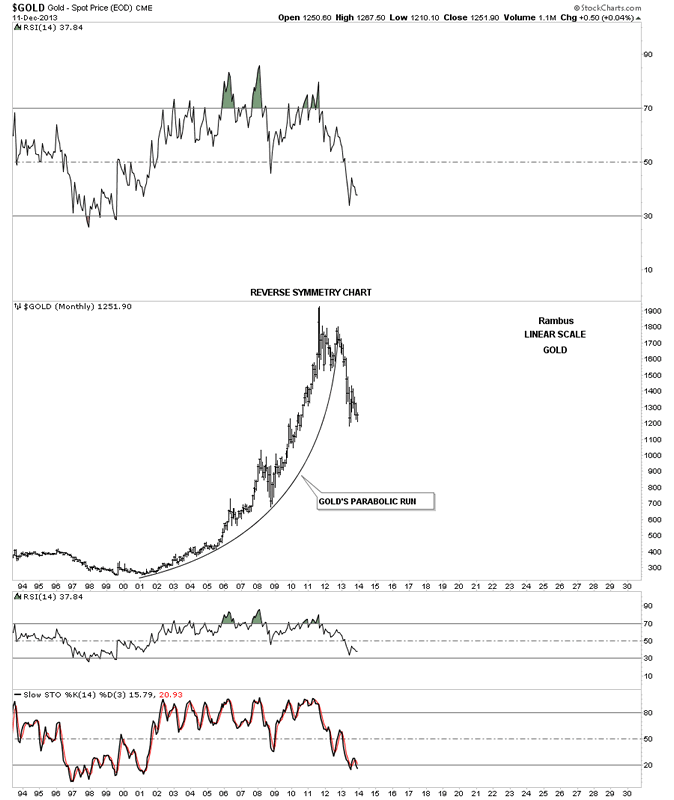
Lets look at one more long term monthly linear chart for gold that shows the parabolic bull market which gold enjoyed for over ten years. If this chart doesn't make an impression on you, that gold's bull market is over, there is no other chart I can show you that can change your mind. This is it. A break below the June low will be the frosting on the cake.
As I have stated many times in the past, the big money will be made by those that can control their emotions, and not jump ship every time a wave hits. This is an epic decline taking place in the precious metals stocks that you just don't see everyday in any market. If one can play this move correctly it can be a game changer in ones life but it's going to take discipline that most don't have. All I can do is show you the Chartology and the rest is up to you.
All the best
Gary (for Rambus Chartology)
FREE TRIAL - http://rambus1.com/?page_id=10
© 2013 Copyright Rambus- All Rights Reserved
Disclaimer: The above is a matter of opinion provided for general information purposes only and is not intended as investment advice. Information and analysis above are derived from sources and utilising methods believed to be reliable, but we cannot accept responsibility for any losses you may incur as a result of this analysis. Individuals should consult with their personal financial advisors.
© 2005-2022 http://www.MarketOracle.co.uk - The Market Oracle is a FREE Daily Financial Markets Analysis & Forecasting online publication.