


U.S. Energy Renaissance
Commodities / Fracking Dec 18, 2013 - 02:54 PM GMTBy: Frank_Holmes

 As we come to the end of 2013, it's a good time to reflect on some of the biggest resources stories of the year. One that immediately comes to mind is the U.S. energy resurgence and its tremendous effect on oil and gas.
Only a few years ago, we were contemplating the supply constraints facing the petroleum industry, as many major oil fields around the world were declining in production. Now, with the disruptive technology in shale oil and gas, we may be looking forward to decades of drilling.
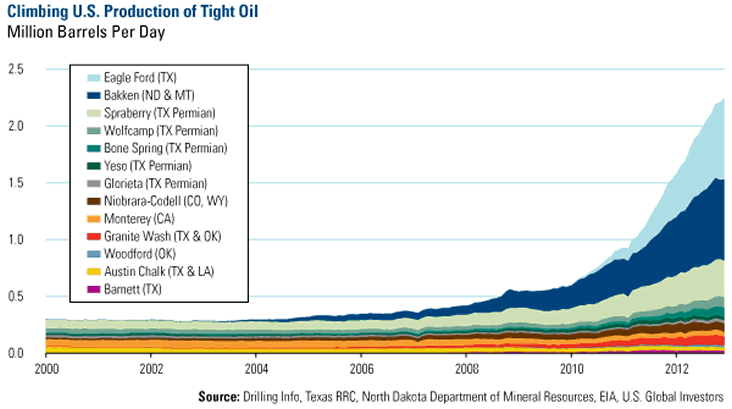
Two charts clearly illustrate the incredible growth in oil and gas. While there are many shale areas around the U.S., there are a few notable hot beds of activity. Regarding the domestic production of tight oil, most of the growth has been in the Eagle Ford area that's outside of San Antonio, Texas, the Bakken formation in Montana and North Dakota, and the Permian basin in West Texas.
At the beginning of 2011, the selected shale areas shown below were producing less than 1 million barrels of tight oil per day. Now, production is nearing 2.5 million barrels per day.
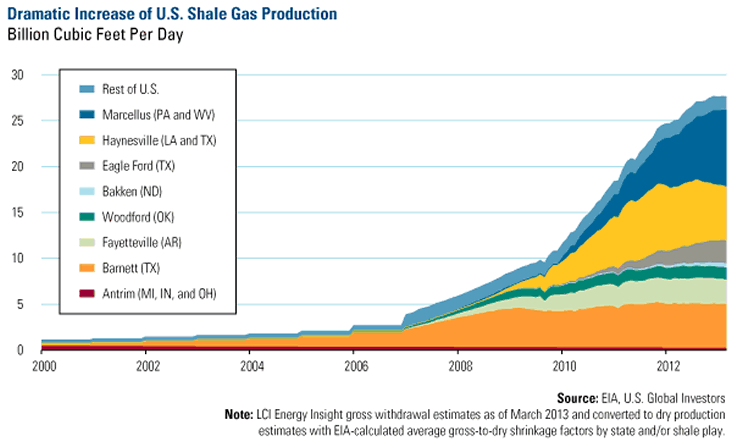
Shale gas in the U.S. has also taken off in recent years, with the Marcellus shale in Pennsylvania and West Virginia, Haynesville in Louisiana and Texas, and Barnett in Texas contributing to the majority of the growth, according to the U.S. Energy Information Administration (EIA). Since 2010, natural gas production among the many shale areas jumped from under 10 billion cubic feet per day to about 27 billion cubic feet per day.
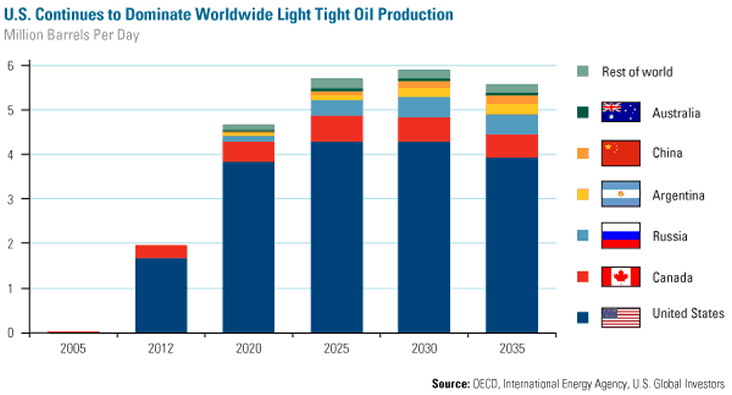
America's ingenuity and success in extracting its oil and gas resources certainly seems to be unique. Even though shale areas are found around the world in Australia, Turkey, Russia and China, the U.S. is expected to supply the majority of light tight oil (LTO) to the world through 2035, as other countries are "struggling to replicate" the experience in the U.S., according to the International Energy Agency.
"Drilling Multiple Horizontal Wells from a Single Pad"
As our resident expert on the natural gas and oil opportunities spouting out across the U.S., Evan Smith, CFA, portfolio manager of the Global Resources Fund (PSPFX), discussed the many investment opportunities recently with Streetwise Reports.
In the published article in The Energy Report, Evan says that lately, the shale activity has been more oil-directed, particularly in the Bakken and Eagle Ford. For 2014, he believes there will be a delineation of acreage, focusing on pad drilling:
"Continental Resources Inc. (CLR) is testing 16 wells per pad in the Williston Basin in North Dakota. The company will repeat that pattern and drive costs down. We've seen a big shift to multi-well pad drilling in 2013, but I think it's going to become much more standardized in 2014. The efficiencies that we've seen, which have led to more productivity with fewer rigs, will probably remain and perhaps even accelerate in 2014."
Earlier this year, we said that oil explorers such as Continental, EOG Resources and Pioneer Natural Resources that were focused on high-margin shale drilling from Texas to North Dakota were set to outperform big oil companies, such as Exxon Mobil and Royal Dutch Shell. We thought these explorers were poised to reap bigger returns than that of energy titans fifteen times their market value, as they devoted almost all of their drilling capital to higher-margin, domestic crude wells.
However, to make the most out of the energy renaissance, investors should look beyond these direct shale plays. As highlighted in The Wall Street Journal, "another boom" is being created in a key ingredient used in hydraulic fracturing: sand. The WSJ finds that companies that mine the ideal sand used to crack rocks and allow the oil and gas to flow out have increased substantially. For example, since going public in August 2012, shares of U.S. Silica have doubled, according to the WSJ.
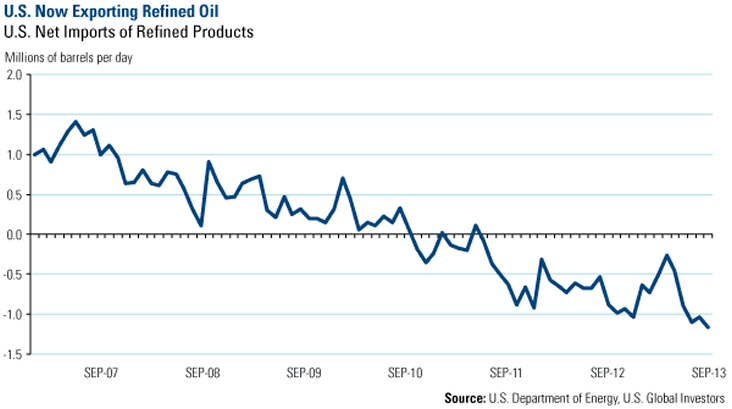
Refiners also benefit tremendously. Because crude oil exports are mostly prohibited, the oil is refined before being shipped to the rest of the world. As you can see in the chart, in recent years, the U.S. has moved from importing refined petroleum products prior to 2010 to exporting more than 1 million barrels per day as of September 2013.
In the Streetwise interview, Evan talks about more opportunities he sees in the pipeline. When you have some time over the next few days, I encourage you to read the interview to stay curious and gain insight for your portfolio.
Looking for more on energy and resources from Frank Holmes? Share your email address and we'll send you a note the next time he posts to his blog. You can also keep informed by following us on Twitter or Facebook.
Foreign and emerging market investing involves special risks such as currency fluctuation and less public disclosure, as well as economic and political risk. Because the Global Resources Fund concentrates its investments in a specific industry, the fund may be subject to greater risks and fluctuations than a portfolio representing a broader range of industries. Holdings in the Global Resources Fund as a percentage of net assets as of 09/30/2013: Continental Resources 2.41%, EOG Resources Inc. 0.0%, Exxon Mobil 0.0%, Pioneer Natural Resources Co. 2.36%, Royal Dutch Shell 0.0%
By Frank Holmes
CEO and Chief Investment Officer
U.S. Global Investors
U.S. Global Investors, Inc. is an investment management firm specializing in gold, natural resources, emerging markets and global infrastructure opportunities around the world. The company, headquartered in San Antonio, Texas, manages 13 no-load mutual funds in the U.S. Global Investors fund family, as well as funds for international clients.
All opinions expressed and data provided are subject to change without notice. Some of these opinions may not be appropriate to every investor.Standard deviation is a measure of the dispersion of a set of data from its mean. The more spread apart the data, the higher the deviation. Standard deviation is also known as historical volatility. All opinions expressed and data provided are subject to change without notice. Some of these opinions may not be appropriate to every investor. The S&P 500 Stock Index is a widely recognized capitalization-weighted index of 500 common stock prices in U.S. companies. The NYSE Arca Gold BUGS (Basket of Unhedged Gold Stocks) Index (HUI) is a modified equal dollar weighted index of companies involved in gold mining. The HUI Index was designed to provide significant exposure to near term movements in gold prices by including companies that do not hedge their gold production beyond 1.5 years. The MSCI Emerging Markets Index is a free float-adjusted market capitalization index that is designed to measure equity market performance in the global emerging markets. The U.S. Trade Weighted Dollar Index provides a general indication of the international value of the U.S. dollar.
Frank Holmes Archive |
© 2005-2022 http://www.MarketOracle.co.uk - The Market Oracle is a FREE Daily Financial Markets Analysis & Forecasting online publication.