


Stocks Off to the Worst Start for the Year Since 2005
Stock-Markets / Stock Markets 2014 Jan 14, 2014 - 09:45 AM GMT

 Michael Lombardi writes: The stock market has just put in its worst first-seven-days-of-the-year trading action since 2005, as concern over where key stock indices will head this year rises. Can the stellar year the stock market had in 2013 continue?
Among those who try to predict where key stock indices will go, Wall Street industry analysts believe that the S&P 500 will rise 4.8% this year, while market strategists believe the S&P 500 will see a decline of 2.3% this year. (Source: FactSet, January 6, 2013.) This tells me that even the professionals can’t figure out which way the market is headed.
On a valuation basis, key stock indices are reaching some dangerous levels. Based on the closing price of the S&P 500 on December 31, the forward 12-month price-to-earnings multiple (P/E) was 15.4. This is the highest forward P/E ratio since May of 2007…and we all know 2007 was the peak for the stock market for five years!
And optimism among stock advisors towards the key stock indices is getting into dangerous territory, too. The indicators I follow suggest the optimism towards key stock indices is at the same level as it was in 2007, while the number of those who are bearish (like me) is at a multi-decade low.
As we move into 2014, I am one of the very few left who are saying key stock indices are dangerously overbought and overpriced.
And if I turn to the economy, the situation looks worse. Four major global economies are in trouble:
In December, China’s manufacturing activity witnessed a shakedown. The HSBC China Manufacturing Purchasing Managers’ Index (PMI) declined to a three-month low in November. New export orders in the country declined for the first time since August, and manufacturing staff declined for the second month. (Source: HSBSC, January 2, 2014.)
India, another well-known economic hub in the global economy, continues to see its manufacturing base weaken. According to the Indian Statistic Ministry, production at Indian factories declined for the second straight month in November. It declined by 2.1% from a year earlier, and production of consumer goods declined by 8.7% in the month. (Source: Reuters, January 10, 2013.)
Britain is in a very similar situation. The Office for National Statistics reported that the index tracking production by the sixth-biggest economic hub in the global economy currently sits at the same level as it did back in July 2013. (Source: Office for National Statistics, January 10, 2014.)
Canada is seeing an economic slowdown, as well. In December, Canada’s Ivey PMI declined to its lowest level in at least 23 months. (Source: Ivey Purchasing Managers’ Index web site, last accessed January 10, 2014.) And fewer jobs are being created in the country. In 2012, the average jobs creation per month was 25,900. In 2013, this rate slowed down to 8,500 per month. This represents a decline in jobs creation of more than 67%. (Source: Statistics Canada, January 10, 2014.) In December of 2013, the Canadian economy shed 45,900 jobs.
And as a whole, demand in the global economy is slowing, as evidenced by the decline in the Baltic Dry Index. Since the beginning of this year, in just a matter of a few days, the index has collapsed by more than 19%, as illustrated in the chart below.
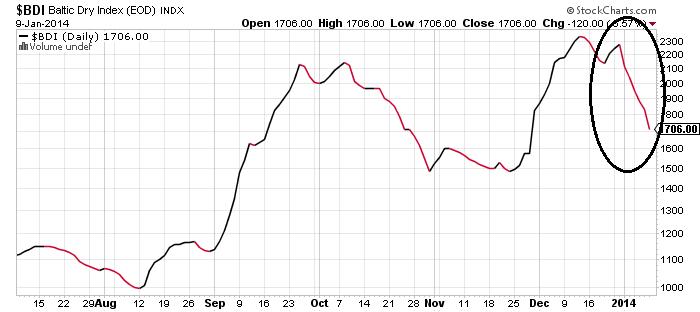
Chart courtesy of www.StockCharts.com
When I look at so many major players in the global economy seeing a slowdown in manufacturing and demand, I can’t see how the U.S. can escape an economic slowdown. Economic activity in the U.S. is highly correlated with the global economy, as a significant number of U.S. companies earn revenues from major economic hubs in the global economy (almost half of the S&P 500 companies derive revenues from outside the U.S.).
So how can key stock indices possibly rise when the S&P 500 is trading at its highest forward P/E ratio since May of 2007, the global economy is clearly slowing, the Baltic Dry Index is collapsing, and bullishness prevails? Dear reader, key stock indices could surprise to the downside big-time in 2014.
This article Stocks Off to the Worst Start for the Year Since 2005 was originally posted at Profit Confidential
© 2014 Copyright Profit Confidential - All Rights Reserved
Disclaimer: The above is a matter of opinion provided for general information purposes only and is not intended as investment advice. Information and analysis above are derived from sources and utilising methods believed to be reliable, but we cannot accept responsibility for any losses you may incur as a result of this analysis. Individuals should consult with their personal financial advisors.
© 2005-2022 http://www.MarketOracle.co.uk - The Market Oracle is a FREE Daily Financial Markets Analysis & Forecasting online publication.