


The Counter-Intuitive Gold Play
Commodities / Gold and Silver 2014 Feb 21, 2014 - 06:38 PM GMTBy: Clif_Droke

 Gold has so far enjoyed a terrific start to the New Year, most recently closing at its highest level late October 2013. It has even succeeded in closing above its psychologically significant 200-day moving average for the first time in over a year.
In summary, gold futures have risen over 12% through Feb. 18, reversing its biggest annual drop in over three decades. It also hit a three-month high on Tuesday. Holdings in ETFs backed by bullion increased by 3.2 metric tons last week - the greatest amount since December 2012 - after slumping 869.1 tons in 2013, when prices were down 28%.
Yet despite the impressive rally, gold analysts remain bearish on the yellow metal's prospects for 2014. An article appearing in the Feb. 18 International Business Times underscores just how negative many forecasters remain on the metals' interim trend.
According to the article by M. Rochan, "A majority of all gold forecasters are sticking with their bearish forecasts for 2014 even after the precious metal logged its best start to a year since 1983." The article quoted Robin Bhar, head of metals research at Societe Generale in London, who said she sees the recent gold rally as merely a "corrective move." To her credit, Bhar was the most accurate gold analyst tracked by Bloomberg over the past two years, yet she stated "we would still want to be bearish about gold." Bhar predicts a fourt-quarter average gold price of $1,050.
Meanwhile Goldman Sachs chief commodities analyst Jeffrey Currie believes that gold will "grind lower" as U.S. growth improves, reaffirming a forecast for prices to hover at $1,050 by the end of the year. The likelihood of weakening currencies in emerging-market economies will increase the risk of further declines for gold, "given the price-sensitive nature of jewelry demand in local currency terms," Goldman said in its report last week.
The bearish bets of most institutional analysts who track gold seem to be based on the expectation of an improving U.S. economy. What these analysts have apparently failed to factor in is the possibility of a weaker U.S. dollar, which would likely put upward pressure on gold and silver.
Could it be that gold is setting up for the ultimate counter-intuitive play in 2014? Already a majority of analysts have found themselves on the wrong side of the gold trade at the start of the year. Perhaps 2014 will be the year these same analysts - who mostly were on the right side of the gold short trade in 2013 - will end up with egg on their faces.
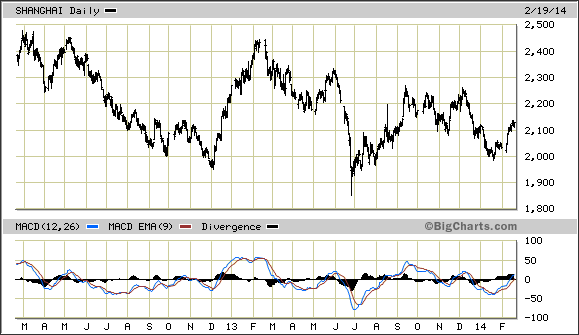
Another factor driving higher gold prices so far this year, ironically, is China. I'm not just speaking of China's voracious demand for physical bullion. After all, China imported 1,158 tons of gold through Hong Kong in 2013, more than double its 2012 total. But I'm also referring also to the growing potential for a China credit crisis. China's stock market (below) is definitely reflecting major vulnerabilities to the country's business sector, if not outright internal weakness.
To put into perspective how vulnerable to a credit crisis China has become, consider the following analysis by the esteemed economist Dr. Ed Yardeni: "When China joined the World Trade Organization during December 2001, the country's banks had $1.4 trillion in loans outstanding, which was equivalent to 35% of US commercial bank loans. At the start of this year, Chinese bank loans rose to a record $12 trillion, now equivalent to 162% of their US counterparts! Those numbers don't include the lending of the shadow banking system."
Yardeni's blog (http://blog.yardeni.com/) depicts a graph of just how perilous China's debt situation has become:
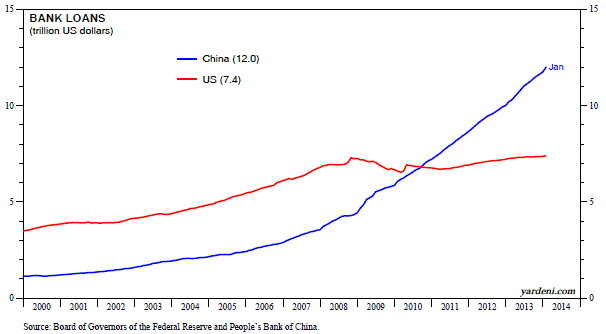
Yardeni points out that China's Producer Price Index (PPI) is down 1.6% year-over-year through January. "It has been deflating since March 2012. China's CPI is still inflating at a moderate pace, with an increase of 2.5% y/y through January," he said. Yardeni's conclusion is that "The combination of lots of debt and mounting deflationary pressures increases the risks of a credit crisis in China."
If 2014 is the year that China's credit market melts down, as many respectable analysts expect, then this could explain why gold has suddenly become the safe haven asset of choice for many investors. The anticipation of economic pain in the world's number two economy is an easy answer for gold's latest rally since the metal benefits from uncertainty and economic volatility.
Indeed, the combination of a weak dollar and the potential for a weak credit market/economy in China is all the fuel gold theoretically needs to continue confounding institutional analysts in the months ahead.
High Probability Relative Strength Trading
Traders often ask what is the single best strategy to use for selecting stocks in bull and bear markets? Hands down, the best all-around strategy is a relative strength approach. With relative strength you can be assured that you’re buying (or selling, depending on the market climate) the stocks that insiders are trading in. The powerful tool of relative strength allows you to see which stocks and ETFs the “smart money” pros are buying and selling before they make their next major move.
Find out how to incorporate a relative strength strategy in your trading system in my latest book, High Probability Relative Strength Analysis. In it you’ll discover the best way to identify relative strength and profit from it while avoiding the volatility that comes with other systems of stock picking. Relative strength is probably the single most important, yet widely overlooked, strategies on Wall Street. This book explains to you in easy-to-understand terms all you need to know about it. The book is now available for sale at:
http://www.clifdroke.com/books/hprstrading.html
Order today to receive your autographed copy along with a free booklet on the best strategies for momentum trading. Also receive a FREE 1-month trial subscription to the Momentum Strategies Report newsletter.
Order today to receive your autographed copy along with a free booklet on the best strategies for momentum trading. Also receive a FREE 1-month trial subscription to the Momentum Strategies Report newsletter.
By Clif Droke
www.clifdroke.com
Clif Droke is the editor of the daily Gold & Silver Stock Report. Published daily since 2002, the report provides forecasts and analysis of the leading gold, silver, uranium and energy stocks from a short-term technical standpoint. He is also the author of numerous books, including 'How to Read Chart Patterns for Greater Profits.' For more information visit www.clifdroke.com
Clif Droke Archive |
© 2005-2022 http://www.MarketOracle.co.uk - The Market Oracle is a FREE Daily Financial Markets Analysis & Forecasting online publication.