


Gold Stocks Bottom - What 10-Baggers (and 100-Baggers) Look Like
Commodities / Gold and Silver Stocks 2014 Mar 08, 2014 - 02:39 PM GMTBy: Jeff_Clark

 Now that it appears clear the bottom is in for gold, it’s time to stop fretting about how low prices will drop and how long the correction will last—and start looking at how high they’ll go and when they’ll get there.
When viewing the gold market from a historical perspective, one thing that’s clear is that the junior mining stocks tend to fluctuate between extreme boom and bust cycles. As a group, they’ll double in price, then crash by 75%... then double or triple or even quadruple again, only to crash 90%. Boom, bust, repeat.
Given that we just completed a major bust cycle—and not just any bust cycle, but one of the harshest on record, according to many veteran insiders—the setup for a major rally in gold stocks is right in front of us.
This may sound sensationalistic, but based on past historical patterns and where we think gold prices are headed, the odds are high that, on average, gold producers will trade in the $200 per share range before the next cycle is over. With most of them currently trading between $20 and $40, the returns could be stupendous. And the percentage returns of the typical junior will be greater by an order of magnitude, providing life-changing gains to smart investors.
What you’re about to see are historical returns of both producers and juniors during three separate boom cycles. These are factual returns; they are not hypothetical. And if you accept the fact that this market moves in cycles, you know it’s about to happen again.
Gold had a spectacular climb in 1979-1980, and gold stocks in general gave a staggering performance at that time—many of them becoming 10-baggers (1,000% gains and more). While this is a well-known fact, few researchers have bothered to identify exact returns from specific companies during this era.
Digging up hard data from before the mid-1980s, especially for the junior explorers, is difficult because the information wasn’t computerized at the time. So I sent my nephew Grant to the library to view the Wall Street Journal on microfiche. We also include information we’ve had from Scott Hunter of Haywood Securities; Larry Page, then-president of the Manex Resource Group; and the dusty archives at the Northern Miner.
Note: This means our tables, while accurate, are not at all comprehensive.
Let’s get started…
The Quintessential Bull Market: 1979-1980
The granddaddy of gold bull cycles occurred during the 1970s, culminating in an unabashed mania in 1979 and 1980. Gold peaked at $850 an ounce on January 21, 1980, a rise of 276% from the beginning of 1979. (Yes, the price of gold on the last trading day of 1978 was a mere $226 an ounce.)
Here’s a sampling of gold producer stock prices from this era. What you’ll notice in addition to the amazing returns is that gold stocks didn’t peak until nine months after gold did.
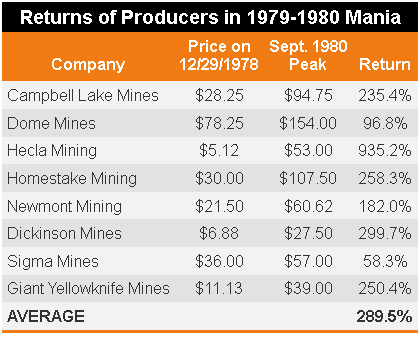
Today, GDX is selling for $26.05 (as of February 26, 2014); if it mimicked the average 289.5% return, the price would reach $101.46.
Keep in mind, though, that our data measures the exact top of each company’s price. Most investors, of course, don’t sell at the very peak. If we were to able to grab, say, 80% of the climb, that’s still a return of 231.6%.
Here’s a sampling of how some successful junior gold stocks performed in the same period, along with the month each of them peaked.
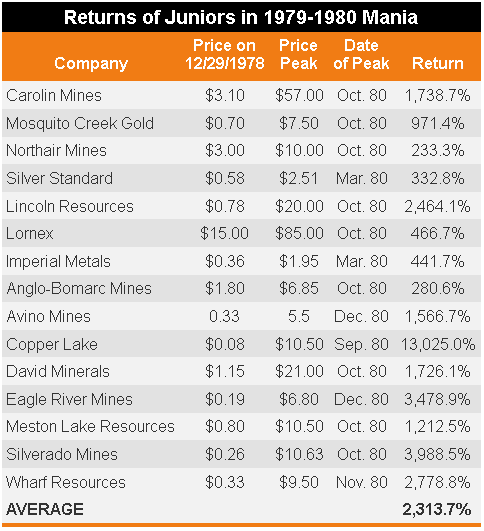
If you had bought a reasonably diversified portfolio of top-performing gold juniors prior to 1979, your initial investment could have grown 23 times in just two years. If you had managed to grab 80% of that move, your gains would still have been over 1,850%.
This means a junior priced at $0.50 today that captured the average gain from this boom would sell for $12 at the top, or $9.75 at 80%. If you own ten juniors, imagine just one of them matching Copper Lake’s better than 100-bagger performance.
Here’s what returns of this magnitude could mean to you. Let’s say your portfolio includes $10,000 in gold juniors that yield spectacular gains such as the above. If the next boom cycle matches the 1979-1980 pattern, your portfolio could be worth $241,370 at its peak… or about $195,000 if you exit at 80% of the top prices.
Note that this does require that you sell to realize your profits. If you don’t take the money and run at some point, you may end up with little more than tears to fill an empty beer mug. In the subsequent bust cycle, many junior gold stocks, including some in the above list, dried up and blew away. Investors who held on to the bitter end not only saw all their gains evaporate, but lost their entire investments.
You have to play the cycle.
Returns from that era have been written about before, so I can hear some investors saying, “Yeah, but that only happened once.”
Au contraire. Read on…
The Hemlo Rally of 1981-1983
Many investors don’t know that there have been several bull cycles in gold and gold stocks since the 1979-1980 period.
Ironically, gold was flat during the two years of the Hemlo rally. But something else ignited a bull market. Discovery. Here’s how it happened…
Back in the day, most exploration was done by teams from the major producers. But because of lagging gold prices and the resulting need to cut overhead, they began to slash their exploration budgets, unleashing a swarm of experienced geologists armed with the knowledge of high-potential mineral targets they’d explored while working for the majors. Many formed their own companies and went after these targets.
This led to a series of spectacular discoveries, the first of which occurred in mid-1982, when Golden Sceptre and Goliath Gold discovered the Golden Giant deposit in the Hemlo area of eastern Canada. Gold prices rallied that summer, setting off a mini bull market that lasted until the following May. The public got involved, and as you can see, the results were impressive for such a short period of time.
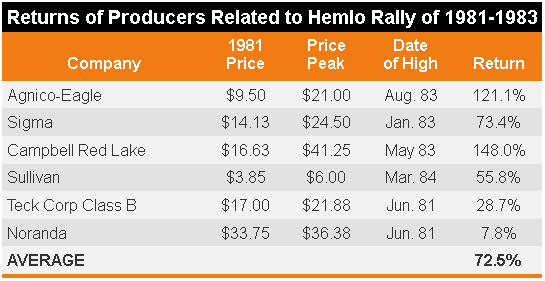
Gold producers, on average, returned over 70% on investors’ money during this period. While these aren’t the same spectacular gains from just a few years earlier, keep in mind they occurred over only about 12 months’ time. This would be akin to a $20 gold stock soaring to $34.50 by this time next year, just because it’s located in a significant discovery area.
Once again, it was the juniors that brought the dazzling returns.
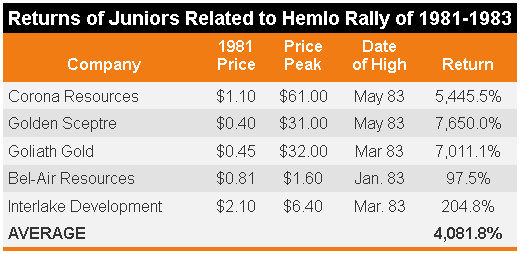
The average return for these junior gold stocks that had a direct interest in the Hemlo area exceeded a whopping 4,000%.
This is especially impressive when you realize that it occurred without the gold stock industry as a whole participating. This tells us that a big discovery can lead to enormous gains, even if the industry as a whole is flat.
In other words, we have historical precedence that humongous returns are possible without a mania, by owning stocks with direct exposure to a discovery area. There are numerous examples of this in the past ten years, as any longtime reader of the International Speculator can attest.
By May 1983, roughly a year after it started, gold prices started back down again, spelling the end of that cycle—another reminder that one must sell to realize a profit.
The Roaring ’90s
By the time the ’90s rolled around, many junior exploration companies had acquired the “intellectual capital” they needed from the majors. Another series of gold discoveries in the mid-1990s set off one of the most stunning bull markets in the current generation.
Companies with big discoveries included Diamet, Diamond Fields, and Arequipa. This was also the time of the famous Bre-X scandal, a company that appeared to have made a stupendous discovery, but that was later found to have been “salting” its drill data (cheating).
By the summer of ’96, these discoveries had sparked another bull cycle, and companies with little more than a few drill holes were selling for $20 a share.
The table below, which includes some of the better-known names of the day, is worth the proverbial thousand words. The average producer more than tripled investors’ money during this period. Once again, these gains occurred in a relatively short period of time, in this case inside of two years.
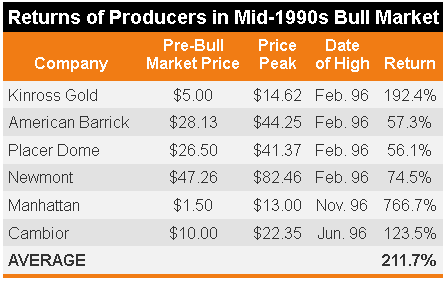
Here’s how some of the juniors performed. And if you’re the kind of investor with the courage to buy low and the discipline to sell during a frenzy, it can be worth a million dollars. Hold on to your hat.
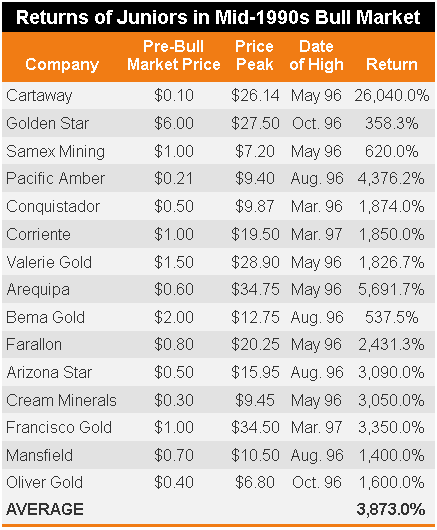
Many analysts refer to the 1970s bull market as the granddaddy of them all—and to a certain extent it was—but you’ll notice that the average return of these stocks during the late ’90s bull exceeds what the juniors did in the 1979-1980 boom.
This is akin to that $0.50 junior stock today reaching $19.86… or $16, if you snag 80% of the move. A $10,000 portfolio with similar returns would grow to over $397,000 (or over $319,000 on 80%).
Gold Stocks and Depression
Those of you in the deflation camp may dismiss all this because you’re convinced the Great Deflation is ahead. Fair enough. But you’d be wrong to assume gold stocks can’t do well in that environment.
Take a look at the returns of the two largest producers in the US and Canada, respectively, during the Great Depression of the 1930s, a period that saw significant price deflation.
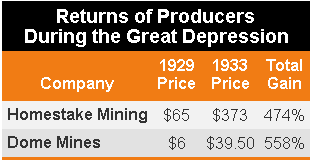
During a period of soup lines, crashing stock markets, and a fixed gold price, large gold producers handed investors five and six times their money in four years. If deflation “wins,” we still think gold equity investors can, too.
How to Capitalize on This Cycle
History shows that precious metals stocks move in cycles. We’ve now completed a major bust cycle and, we believe, are on the cusp of a tremendous boom. The only way to make the kind of money outlined above is to buy before the boom is in full swing. That’s now. For most readers, this is literally a once-in-a-lifetime opportunity.
As you can see above, there can be great variation among the returns of the companies. That’s why, even if you believe we’re destined for an “all-boats-rise” scenario, you still want to own the better companies.
My colleague Louis James, Casey’s chief metals and mining investment strategist, has identified the nine junior mining stocks that are most likely to become 10-baggers this year in their special report, the 10-Bagger List for 2014. Read more here.
Disclaimer: The above is a matter of opinion provided for general information purposes only and is not intended as investment advice. Information and analysis above are derived from sources and utilising methods believed to be reliable, but we cannot accept responsibility for any losses you may incur as a result of this analysis. Individuals should consult with their personal financial advisors.
Casey Research Archive |
© 2005-2022 http://www.MarketOracle.co.uk - The Market Oracle is a FREE Daily Financial Markets Analysis & Forecasting online publication.