


Weekly Gold and Silver Technical Analysis Report - 4th March 2007 - Technically Precious with Merv
Commodities / Forecasts & Technical Analysis Mar 04, 2007 - 04:16 PM GMTBy: Merv_Burak

WOW! but no time to panic -- yet. Not good short term but still okay for the other time periods. Let's get on with the analysis.
GOLD LONG - TERM
Getting right to it, the long term P&F chart has reversed direction but not trend . What this means is that on the chart we are now heading downwards with the O s but have not issued a reversal of basic trend yet. On the long term chart we are still some distance to any kind of trend reversal signal so hang on to your hats, we may be in for more volatility ahead. At the present time the action would have to go as low as $555 before issuing a new bear signal. With some up and down volatility, enough to reverse the direction of the chart again, that could be increased to the $600 level but let's see what transpires. For now, the long term, per the P&F , is still intact.
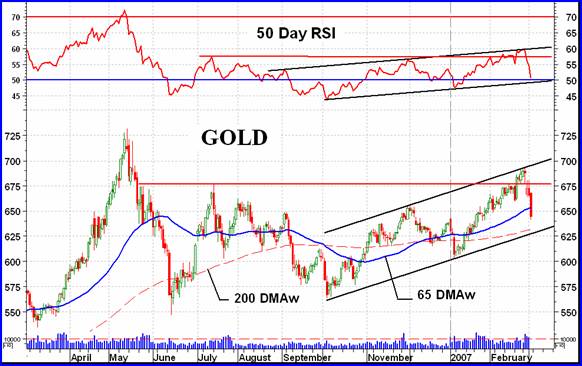
As for the normal indicators, everything is still okay. The week's action, although very volatile, was still all above the long term positively sloping moving average line. The long term momentum is still in the positive zone although it has reversed direction and is heading lower. The long term volume indicator is still positive being above its long term trigger moving average line. There is no reason to panic but with all the indicators weakening one would not yet be making NEW long term commitments. I am of the opinion that one should reduce risk by trading with the trend and direction not trying to pick the bottom. On a rare occasion one might just pick the bottom but most of the time bottom fishing is a loser's game unless one is doing so at well established support levels. For gold that next support level could be at the $600 level where the up trending channel lower trend line and the popular 200 DMA are at.
The long term technical position has not reversed but has deteriorated somewhat to a + NEUTRAL rating.
INTERMEDIATE TERM
When looking at the intermediate term chart on the previous page one can clearly see the false upside break that occurred in both the price and momentum action. Although in both cases the action broke through a several month resistance level the more powerful feature became the up trending channel. Again, in both cases the action just touched that upper channel line and reacted downwards. This is not to say that the channel will always be the dominant indicator BUT it does say that one should look out for all technical indications before becoming fully fixed in one direction or another. This is, however, often unrealistic as one can almost always find some indicator or resistance ahead to watch out for and one will never end up acting. So, one must try and guess which is the more dominant indicator and go with it, but keeping one eye open for the other.
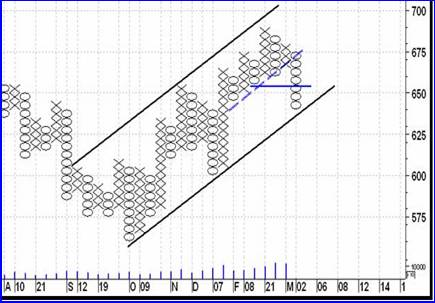
The above is what the intermediate term P&F looks like from Aug of last year. Once again we see an up trending channel that has boxed in the action since the Oct low. Some might look at the more recent action in the upper half of the channel and use the dashed up trend line as the trend line for a reversal signal but I am inclined to wait till the primary up trend line is broken before calling a P&F reversal. We do have the first item, the breaking below two previous lows but not the breaking of the up trend line for our final confirmation.
Back to our normal indicators. Friday's sharp sell off has moved the price below the intermediate term moving average line and the line has turned down at the same time. Momentum has likewise taken a steep dive but is still in the positive zone, but only just slightly. The volume indicator has moved sharply lower and has crossed below its trigger moving average line but the line is still slightly pointing upwards. Despite the momentum still being in its positive zone the indicators sum up to a BEARISH intermediate term position.
SHORT TERM
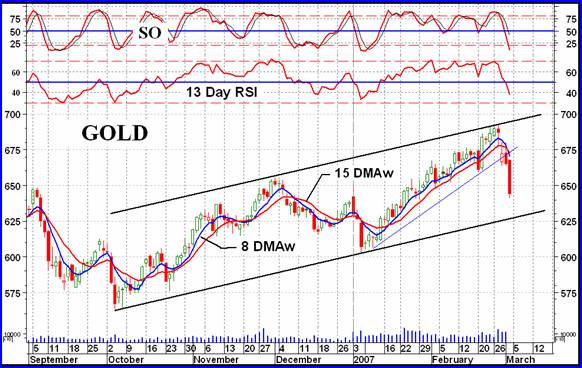
As can be expected the short term picture was demolished. On Wednesday the price closed below a short term up trend line and below its moving average line. The moving average turned down at the same time. Short term momentum, although seriously plunging downwards, did not break below its neutral line until Thursday. So one knew something was not right on Wednesday, confirmed on Thursday and the plunge came on Friday. There's nothing more to do but go with the flow. On the short term there is no evidence at this point that the downside action has finished. It still looks like more downside to come.
IMMEDIATE TERM
The very short term action was similar to that of the short term. Here, however, the aggressive Stochastic Oscillator made a more emphatic turn having been in the overbought zone and then dropping below the overbought line and its trigger line. The move was sharp in the SO and it has now entered its oversold zone. One might expect some hesitation to the negative price move or even possibly a recovery but most likely the action will continue lower or at the least, sideways. I would expect the price to reach or come very close to the lower channel line before recovery.
NORTH AMERICAN GOLD INDICES
This week is the turn of the AMEX Gold BUGS Index.
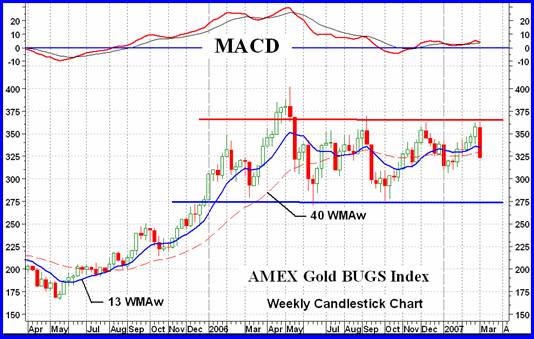
For several months now the AMEX Gold BUGS Index has been going nowhere. What initially was the right shoulder of a potential head and shoulder pattern ended up to be a lateral trend. The volatile action of this past week was a technical reaction to the upper, resistance, line. I know there were probably other reasons for the down turn but as a technician I look for the technical explanation. It now looks like the Index is heading towards the lower support line. Although the other North American major gold Indices may not be boxed in as firmly as the Gold BUGS Index is, the basic movement, going nowhere, is seen in all of the Indices. It should be noted that this is not the case for the Merv's Precious Metals Indices. Those Indices have been into all time new high territory recently, the Gamb-Gold Index some 15% into new highs.
As long as the Index stays inside the box with support at 275 and resistance at about 370 it is a lateral trend with short term ups and downs. Per this Index we are into a traders market, not an investors market.
MERV'S PRECIOUS METALS INDICES
I will cut the commentary to the essentials so that I can get this weekly commentary published early. I would expect many readers are curious as to what's happening, what's moving and in what direction.
First, the precious metals as a group had a bad week (surprise?) with a 7.8% overall drop. Most had losses in the 9% range with some, like the Merv's Gamb-Gold Index at 4.1%, with lower losses to bring the average to the 7.8% level. The Composite Index of Precious Metals Indices closed below its intermediate term moving average line and the line turned down. On the long term the Index is still above a positive moving average line. Momentum wise, both momentum indicators are heading lower real fast. The intermediate term is just a hair above its neutral line while the long term is further above. Based on my rating system the intermediate term would be classified as BEARISH and the long term as + NEUTRAL. These would be the ratings for the Composite Index of Precious Metals Indices. For the individual Indices ratings see the Merv's Gold Indices page technical information table.
MERV'S GOLD & SILVER 160 INDEX
With a weekly decline of 7.3% the universe of 160 stocks is just slightly better than the Composite Index mentioned above. As for the advancing and declining issues, it was a slaughter with 137 decliners (86%) and only 19 advancers (12%). The summation of individual ratings also deteriorated significantly. Only the long term is still BULLISH at 56%. The short term is BEARISH at 66% as is the intermediate term at 64%.
Looking at the Index chart we see that the Index closed still above both moving average lines and both lines are still pointing upwards. Both momentum indicators are also in their positive zone but dropping sharply lower from last week. The Table of technical information uses a different momentum indicator for its information and that one has already dropped below its neutral level for the intermediate term. I would go with the RSI indicator that I use for the commentary analysis. The Index is still BULLISH for both time periods based upon the chart.
Although the Index took a sharp tumble during the week resulting in numerous double digit losses there was only one stock that made my arbitrary plus/minus 30% weekly move category, and that was a gain of 76.5% for Rubicon Minerals (mentioned here last week), That's what happens when Rob McEwen gets involved with a company. Only one stock made it into the 20% category and that was a new stock in the universe, Romios Gold with a 24% loss. It had gained some 130% in the previous two weeks and over 270% since its low in January so was due for a reaction I guess one might call the trading this past week as one of anxiety but not panic.
MERV'S QUAL-GOLD INDEX - MERV'S SPEC-GOLD INDEX - MERV'S GAMB-GOLD INDEX
The Qual-Gold had the worst performance of the three sector Indices (only exceeded by the Qual-Silver) with a loss of 9,4% on the week. The performance improves as we go down in quality with a 7.0% loss for the Spec-Gold Index and only a loss of 4.1% for the Gamb-Gold. Rubicon by itself represented 2.5% of this performance so even without Rubicon the Gamb-Gold still out performed the other Indices. All Qual-Gold component stocks declined during the week while the Spec-Gold had 3 winners and the Gamb-Gold had 6 winners. All summation of individual ratings were plunged back into the BEARISH side except for the long term ratings, which remained BULLISH, and the intermediate Gamb-Gold rating which moved into the NEUTRAL.
As for the charts, Everything is still Positive for the long term for all Indices. For the Intermediate term things are somewhat muddled. The Qual-Gold Index Has gone BEARISH with the Index closing below its negative moving average line and momentum dropping into the negative zone. The Spec-Gold Index closed just below its moving average line but the line is still pointing upward. The momentum indicator is still positive so we have a + NEUTRAL rating for the intermediate term here. As for the Gamb-Gold Index, everything is still weel inside the positive so we are still BULLISH here.
SILVER
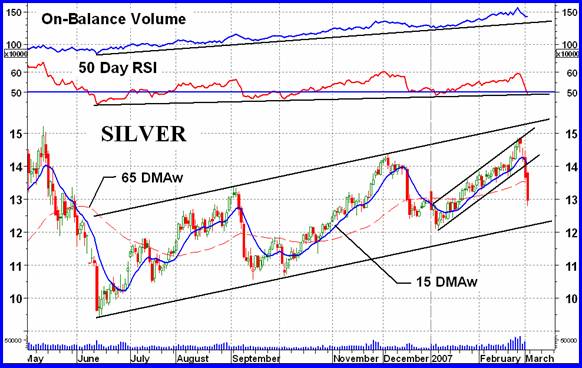
One thing the chart above shows is that one is taking huge risks if one ignores the short term moving average line. Although not perfect (nothing is) has kept you in during most of the up and down moves. I like the 15 DMAw line while others prefer the simple 10 DMA (one being a weighted average and the other a simple average). Both give almost identical performance. We are now into a negative moving average line so expect more downside until the action breaks back above the line and the line turns back up. I would expect the action to continue trapped within this gentle up trending channel but it has to move above or below sometime. O)f interest is the solid up trend lines drawn on the momentum and volume indicators. The momentum has just broken below its trend line for the first time in many months while the volume indicator is still above its line. Also of interest is the negative divergence of the momentum with the price action at the recent top. Momentum failed to make a new high giving us a warning.
MERV'S QUAL-SILVER INDEX
The week's worst performer in the Merv's Precious Metals Indices Table the Qual-Silver Index declined 10.3% on the week. Of course it had been one of the better performers leading up to the decline. Not surprising, all 10 component stocks declined during the week. As with most Indices the long term is still BULLISH while the intermediate term has problems. With the Index below its negative moving average line but the momentum still in the positive territory, although moving lower fast, I would be inclined to rate the intermediate term as now being BEARISH.
MERV'S SPEC-SILVER INDEX
With a 9.0% decline on the week the Spec-Silver Index did just a little bit better than the North American major Indices. As with most of Merv's Indices, the Spec-Silver Index summation of individual ratings moved into the BEARISH except for the long term, which remained in the BULLISH camp. The chart indicators are giving us a slightly better story than the Qual-Silver with a BULLISH long term and intermediate term ratings. However, the intermediate term is very, very close to going bearish.
MERV'S PRECIOUS METALS INDICES TABLE
That's it for this week.
Merv Burak,
CMTHudson Aero/Systems Inc.
Technical Information Group
for Merv's Precious Metals Central
Web: www.themarkettraders.com
e-mail: merv@themarkettraders.com
During the day Merv practices his engineering profession as a Consulting Aerospace Engineer. Once the sun goes down and night descends upon the earth Merv dons his other hat as a Chartered Market Technician ( CMT ) and tries to decipher what's going on in the securities markets. As an underground surveyor in the gold mines of Canada 's Northwest Territories in his youth, Merv has a soft spot for the gold industry and has developed several Gold Indices reflecting different aspects of the industry. As a basically lazy individual Merv's driving focus is to KEEP IT SIMPLE .
To find out more about Merv's various Gold Indices and component stocks, please visit www.themarkettraders.com and click on Merv's Precious Metals Central . There you will find samples of the Indices and their component stocks plus other publications of interest to gold investors. While at the themarkettraders.com web site please take the time to check out the new Energy Central site for the most comprehensive survey of energy stocks on the
© 2005-2022 http://www.MarketOracle.co.uk - The Market Oracle is a FREE Daily Financial Markets Analysis & Forecasting online publication.