


Gold and Silver Analysis - One Step Forward, Two Steps Back
Commodities / Forecasts & Technical Analysis Mar 04, 2007 - 08:11 PM GMTBy: Dominick

It's true that the buying power of gold and silver could increase considerably during a period of acute economic calamity. But, as economists and other analysts have been quick to note over the past few days, the current data simply do not decisively forecast a recession in the U.S. , let alone a catastrophe of apocalyptic proportions. Yes, mortgage defaults are still a legitimate concern, but the numbers simply don't show any significant spillover from the housing or credit bubbles, at least not yet.
The most recent manufacturing data actually indicates a modest recovery in that sector. Even weak capital expenditure in the durable goods data, the seeming straw that broke the camel's back, is a shot across the bow, but hardly a sign of the end times.
So, while physical metal is still a good hedge against major economic upheaval, readers of this update know that gold and Goldilocks have been moving hand-in-hand over the last few months, and that a modestly soft patch for the U.S. economy would predictably spell an intermediate term decline in interest rates with accompanying weakness in metals. But, as we've said, there's no economic disaster as yet, and the Fed's actually forecasting stronger growth for later this year. Fears over China 's economy, too, have proved entirely unfounded, all of which suggests the steep selloff in metals and equities last week was a financial, rather than economic, event.
“Since the yen carry trade is the primary source of the world's liquidity today, higher interest rates in Japan could hurt both the dollar and gold.” ~ Precious Points: The Best Risk/Reward Trade Available , Feb. 18, 2007
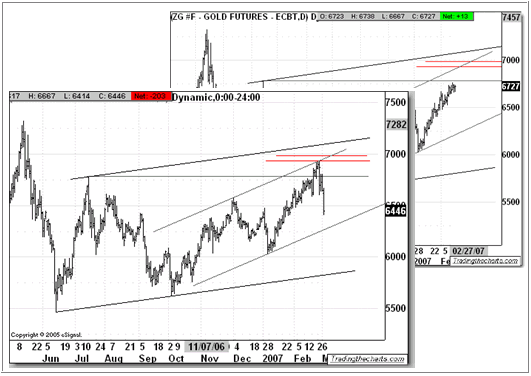
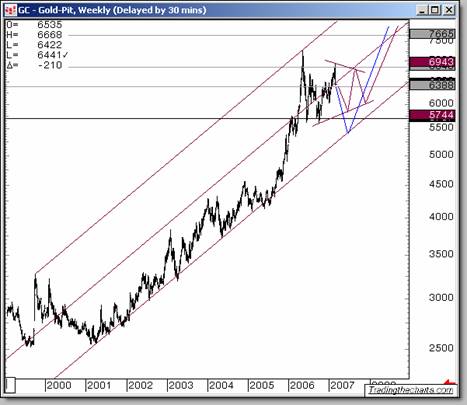
(chart by Dominick)
The chart in the background was originally published in this update on February 18, when membership in Trading the Charts was only half-jokingly declared the best risk/reward trade available on the internet. Since the reversal, there's been lots of questions why precious metals performed so poorly in a week that saw much uncertainty, outright panic, and a global, broad-based selloff in equities. If metals are a safe haven, the logic goes, they should benefit from panic as investors flock to stable assets, particularly ones with inherent value. In other words, investors ask, who hijacked the flight to quality?
The answer is simple, of course, in the right context.
It's true that the buying power of gold and silver could increase considerably during a period of acute economic calamity. But, as economists and other analysts have been quick to note over the past few days, the current data simply do not decisively forecast a recession in the U.S. , let alone a catastrophe of apocalyptic proportions. Yes, mortgage defaults are still a legitimate concern, but the numbers simply don't show any significant spillover from the housing or credit bubbles, at least not yet. The most recent manufacturing data actually indicates a modest recovery in that sector. Even weak capital expenditure in the durable goods data, the seeming straw that broke the camel's back, is a shot across the bow, but hardly a sign of the end times.
So, while physical metal is still a good hedge against major economic upheaval, readers of this update know that gold and Goldilocks have been moving hand-in-hand over the last few months, and that a modestly soft patch for the U.S. economy would predictably spell an intermediate term decline in interest rates with accompanying weakness in metals. But, as we've said, there's no economic disaster as yet, and the Fed's actually forecasting stronger growth for later this year. Fears over China 's economy, too, have proved entirely unfounded, all of which suggests the steep selloff in metals and equities last week was a financial, rather than economic, event.
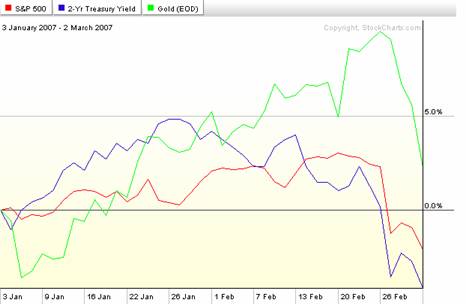
Interestingly, the “follow the money” chart above shows that while last week's market action was largely a reallocation to treasuries, precious metals bore the brunt of the selling. The last rally in bonds clearly reflects some economic concern, but the most likely culprit for the weakness in metals is a shift in the dynamics of global liquidity, a subtle change that evolves into the revaluation of all asset classes and the re-pricing of risk. Liquidity, of course, is the food that feeds both the metals bull and the Goldilocks economy. Indeed, domestically, last week saw bank credit and money supply increase at a pace below the recent trend. But, as the quote at the top of this update states, the yen carry trade has been a primary source of new capital internationally and, of the forces at play last week, was probably the largest single influence on precious metals.
The lag time between the Japanese rate hike and the selloff in metals is easily explained. As last week's updated stated, the carry trade could not unwind in a single night. There's more factors involved than simply the Bank of Japan's lending rate and these have taken a little time to adjust. First, new carry trades are based on the spread between the Japanese rate and higher return rates for other assets, typically treasuries. Our much expected decline in U.S. bond yields, on top of the BoJ rate hike, pinched the spread on both ends, discouraging new injections of liquidity from this source. As U.S. bonds extended their rally last week, the situation only grew worse, resulting in a selloff Friday for metals. To make the situation worse, the yen has also appreciated considerably over the last two weeks, on the rate hike and now also on low measured inflation, and the result has been a sort of stop loss selling, the "unwinding" of existing carry trades that's gotten so much attention.
Though the rate hiking campaign appears to have been meticulously crafted for plodding regularity and predictability, that the Bank of Japan is hiking rates at all signals a change in trend that runs counter to the easy money of the past several years. But, while a certain degree of softness is rational and inevitable, the swirl of economic forces, as well as the emotional charge of highly volatile markets, has created an irrational feedback loop that's far overstated the current situation. There's plenty of appropriate debate now over exactly how much money the yen carry trade represents and how much of global investment is underwritten by yen carry liquidity. No one seems to know for sure, but the prevailing wisdom says the reaction so far is exaggerated and overblown compared to the actual changes in policy to date.
Inevitably, panicky, volatile action is bound to produce dislocations ripe for a sharp correction, and last week was no different. In addition to its effects in the carry trade, appreciation of the yen threatens valuations in the export-based Japanese economy. Perhaps this justifies a selloff in the Nikkei, but not necessarily reflecting global economic weakness. But, because further increases in the yen could do significant damage, the trend is unlikely to continue unabated in the short term. Additionally, Japan 's CPI data last week showed no inflation, a factor that will likely delay the next rate hike and limit further rises in the yen. Sharp or not, then, there's considerable reason to believe the dollar will recover ground over time as it moves to correct the current imbalance against the yen, and this move could ease pressure on the carry trade, liquidity, and precious metals.
Even with this upbeat analysis, the charts below suggest a conservative approach. A major theme of this update has been that there is too much underlying demand for metals to allow a catastrophic selloff. While some of the moves lower this week were certainly steep, and probably painful for some, the moves in gold and silver are far from disastrous. Which is still to say, of course, they may not yet have bottomed. Even though they've now moved below the past highs they'd recently overtaken, the charts above show both gold and silver are still considerably above key support levels that indicate the ongoing uptrend, and still hold positive MACD correlations after having bounced off the 70 RSI level mentioned in previous updates.
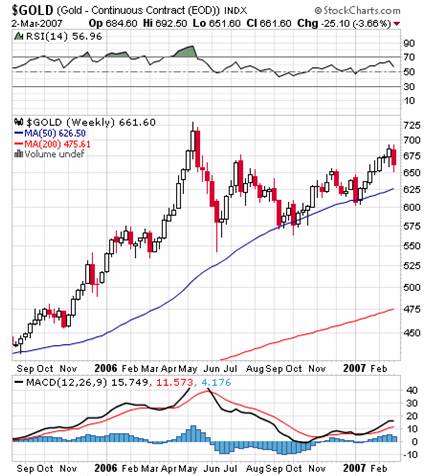
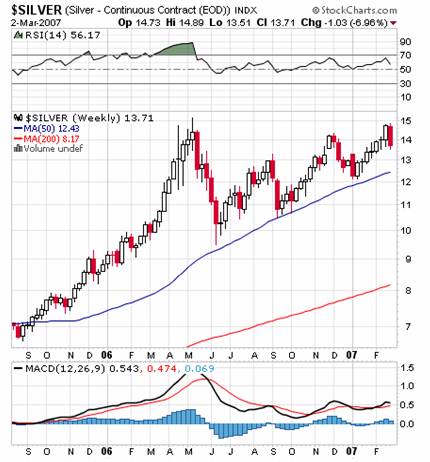
China is not about to collapse. Demand for metals is not about to disappear. This is not the end of the bull market in metals and the blue moving average trend lines above should roughly hold. It's still reasonable, though, to expect some more short term weakness until the newfound volatility works to correct the recent overreaction. And, unless it's driven by exogenous factors such as a terrorist attack or war with Iran, even a bounce from here is unlikely to produce significantly higher highs if, all else being equal, the global trend in liquidity is now moving towards tightening, though potentially, if the U.S. finds itself the only country cutting interest rates, metals could appreciate in dollar terms while staying flat in other currencies.
Whether this last selloff may have been a bit preemptive and overdone, or if it still has a little way to go, the fact that there was a rapid decline in stocks last week illustrates the fear that underlies the markets. None of the economic threats outlined in the opening of this update have actually occurred, and this might be the very realization that sparks an attempt at recovery. Still, the economy is weaving through a minefield that could explode at any moment, turning this week's relatively tame financial event into something far more sinister.
The second half of last month's lower yield prediction was buoyant stock markets. Despite the Fed's forecast for the overall economy, Standard and Poor's is projecting weaker corporate earnings in 2007, which keeps the bulls relying on a rate cut that the Fed is hard pressed to deliver with the dollar under constant pressure and inflation less than contained. Even if the Fed did cut rates as early as May, current mortgage rates are not keeping pace with the decline in bond yields, meaning that the lower interest rates are not yet benefiting home buyers and may not be enough to prevent further defaults on existing mortgages. Freddie Mac is now restricting subprime lending practices, which is a positive, disciplined move, but very poorly timed since it didn't prevent the credit bubble and will now only exclude an entire segment of potential home buyers when the economy needs them most.
Consumer confidence is already slipping, and, after the latest selloff, might not recover in time for a robust buying season in housing markets this spring. Without a significant recovery in stocks and/or housing, consumer spending will begin a spiral downward that could possibly take the whole economy with it. While plenty of economists continue to scoff at the idea of a by-the-books recession, the “r” word is at least now back in the lexicon and a legitimate topic of conversation, a sign that even optimists believe things could always get worse before they get better. As we've already mentioned how metals are likely to react in periods of economic crisis, this, ultimately, is the description that fits perfectly with the intermediate technical forecast in precious metal.
(chart by Dominick)
In conclusion, if you've made profits on the recent rallies, you might be considering transferring those profits into physical metal in the near future. If you're still holding paper positions at a loss, consider selling into any strength over the next month or two. If you're strictly holding physical for the long term, thank this update for keeping you from buying at the top and continue holding out for better entry points as outlined in the forums.
By Joe Nicholson (oroborean)
This update is provided as general information and is not an investment recommendation. TTC accepts no liability whatsoever for any losses resulting from action taken based on the contents of its charts, commentaries, or price data. Securities and commodities markets involve inherent risk and not all positions are suitable for each individual. Check with your licensed financial advisor or broker prior to taking any action.
© 2005-2022 http://www.MarketOracle.co.uk - The Market Oracle is a FREE Daily Financial Markets Analysis & Forecasting online publication.